CS 195-G: Automated Panorama Stitching
The goal of this project was to implement automated panorama stitching, which combines a collection of photos into a wide-angle panorama using feature matching.
Algorithm
Although this algorithm combines many images into one panorama, it combines them two at a time. It keeps one image fixed, and attempts to find the best homography for the other image so that they overlap as seamlessly as possible. A homography can be used because the algorithm assumes that the "eye" of the camera does not move between pictures (it must only orbit in place). In this example, the picture of the whole bus on the left will be merged with the picture of the street on the right.
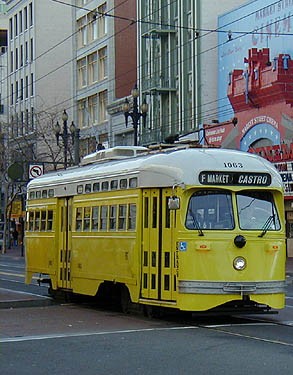 Left image |
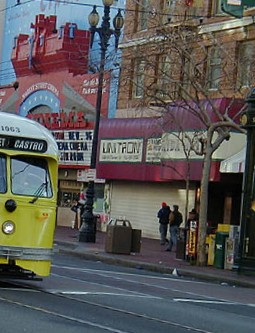 Right image |
To compute the homography we need four points in each image, because the transform computation can be formulated as a matrix equation with eight unknowns. I have manually picked the eight correspondence points below (they will be computed automatically later).
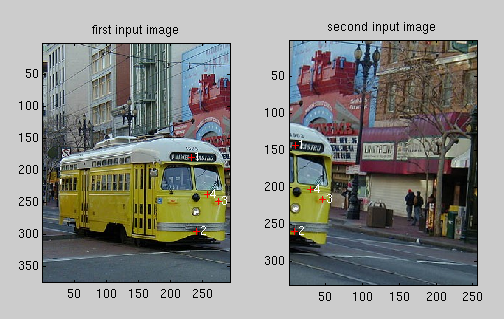
The eight correspondence points
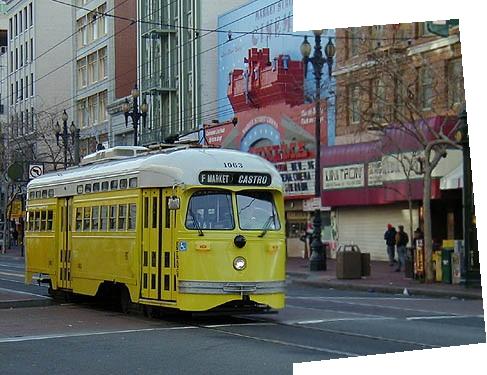
Given the correspondence, the left image can be transformed so it overlaps the right image. Before I transformed the image, I first transformed the corners of the image and expanded the image to make room for them, so both images fit tightly in the result. The overlapped part in the image below, which uses information from both images, is a simple average.

The left image manually adjusted to the right image
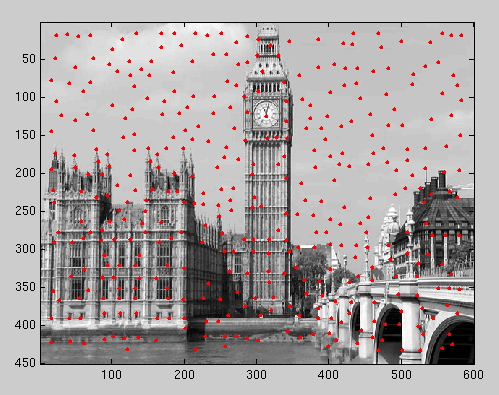
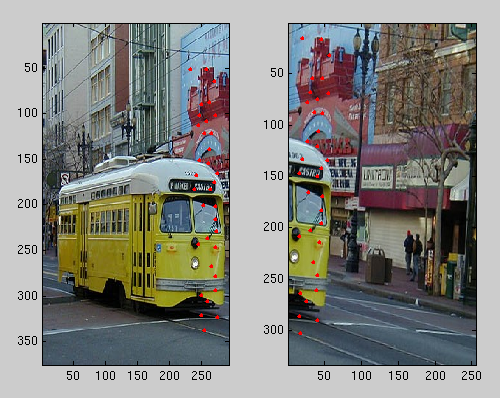
To find these correspondence points automatically involves many steps to extract feature points from both images and compare them. The interest points were first generated with Harris corner detection, then filtered down to 400 points. To get 400 points, you could either use the strength returned from the Harris corner detection or Adaptive Non-Maximal Suppression (ANMS). Adaptive Non-Maximal Suppression tries to more evenly filter interest points, while still keeping the strong corners. The results of these filters are shown below.
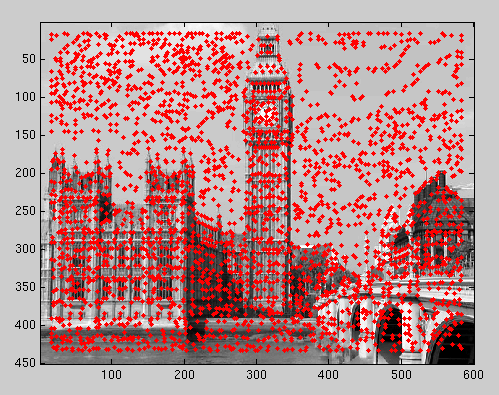 All interest points |
 Strongest 400 (Harris strength) |
 Top 400 (adaptive) |
 Top 300 (adaptive) |
 Top 200 (adaptive) |
 Top 100 (adaptive) |
The next step is to find pairs of features, one in each image, so we can recover the homography between them. The features I ended up using where 12x12 grayscale images centered around each feature point. The Harris corner detector didn't choose interest points too close to the edge of the image, so each feature image was completely full with image content. Each feature was standardized by subtracting the mean and dividing by the standard deviation.
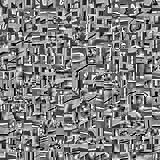
8x8 features for the top 400 points
To find pairs of features, I compared each feature point in the left image to each feature point in the right image, and took the one with the lowest sum of squared differences (SSD). Features were rejected if the ratio between the first and second lowest SSD scores was more than a certain threshold, which was recommended by Brown, et al. Below I compare extracting features by Harris weight and by Adaptive Non-Maximal Suppression, and matching them with pure SSD or with ratios. For pure SSD, matches were only added if their SSD score was less than 40, and for the ratios, matches were only added if the ratio of the first and second lowest SSD scores was less than 0.5. These numbers are for standardized features.
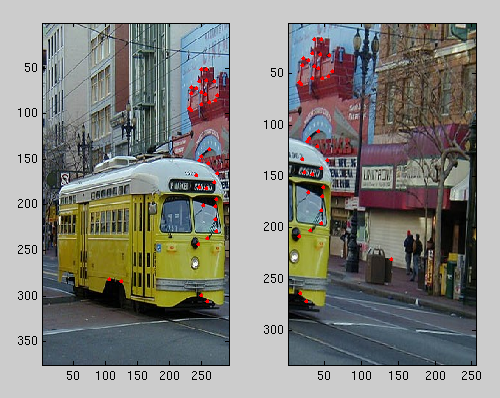 Top 400 by Harris weight, down to 36 with SSD |
 Top 400 by Harris weight, down to 44 with ratios |
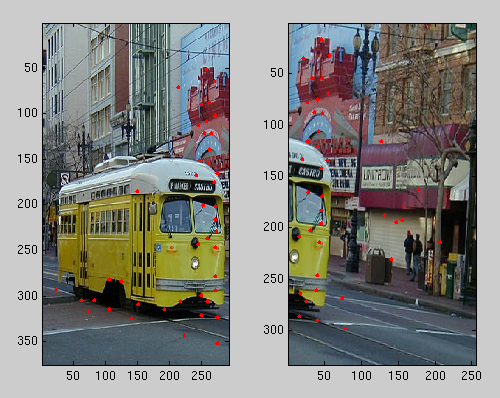 Top 400 by ANMS, down to 43 with SSD |
 Top 400 by ANMS, down to 34 with ratios |
I found that a combination of Adaptive Non-Maximal Suppression matched with SSD ratios (bottom right) was most effective because in this test, there is not a single mismatched point and there was a broader distribution of points covering the overlapping region.
To discard incorrect feature pairs and discover the best homography between the two images, I used the RANSAC algorithm (RANdom SAmple Consensus). RANSAC repeatedly pairs features at random and tests the transformed features against their locations in the other image. The transform used to generate the following image was recovered automatically using RANSAC.

The left image automatically adjusted to the right image
Graph Cuts
In the images above I used a simple average to combine the two images when they overlap, but it does not work well. For example, in the image below there is an obvious seam where the two images are overlapped.
In addition to visual seams, averaging also creates "ghosts" when moving objects, like people, walk by as the photos are being taken. Ghosting can also occur when the "eye" of the camera moves between photos, because the homography assumes a stationary eye and therefore the algorithm cannot find an exact homography from one image to another (it is impossible). Graph cuts avoid this issue because each pixel is either from one image or another, but never both.
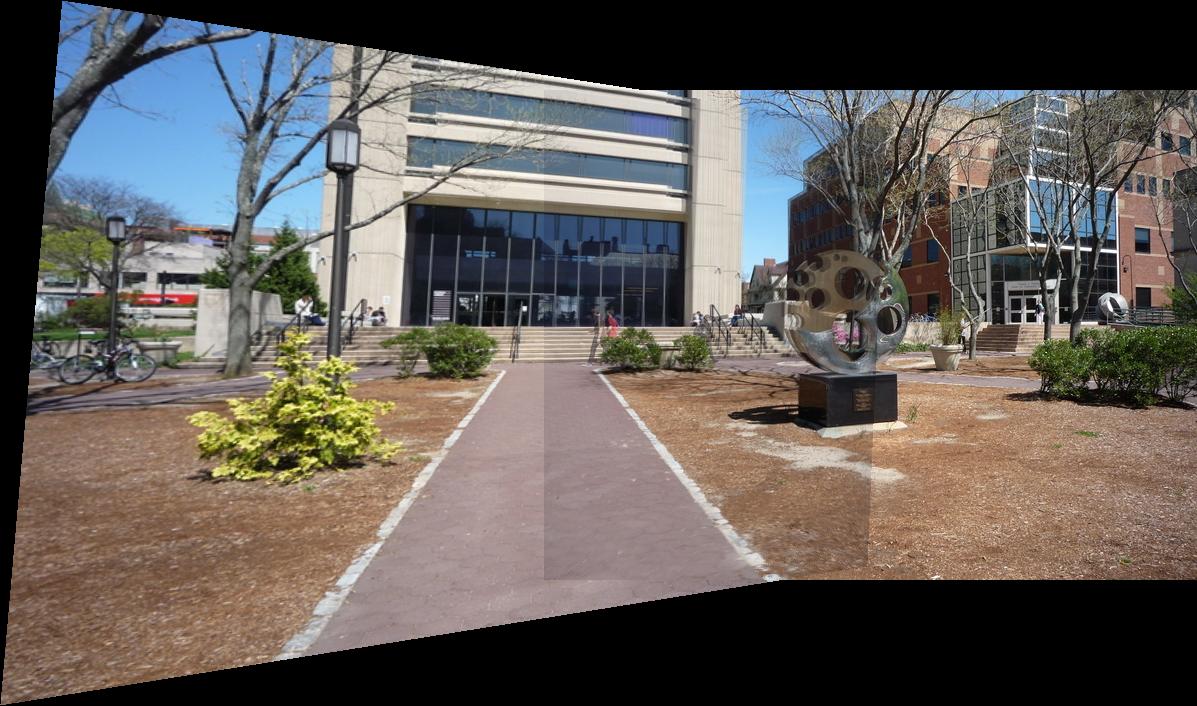
Averaging does not hide seams, and leaves ghosting due to moving people and a different camera position
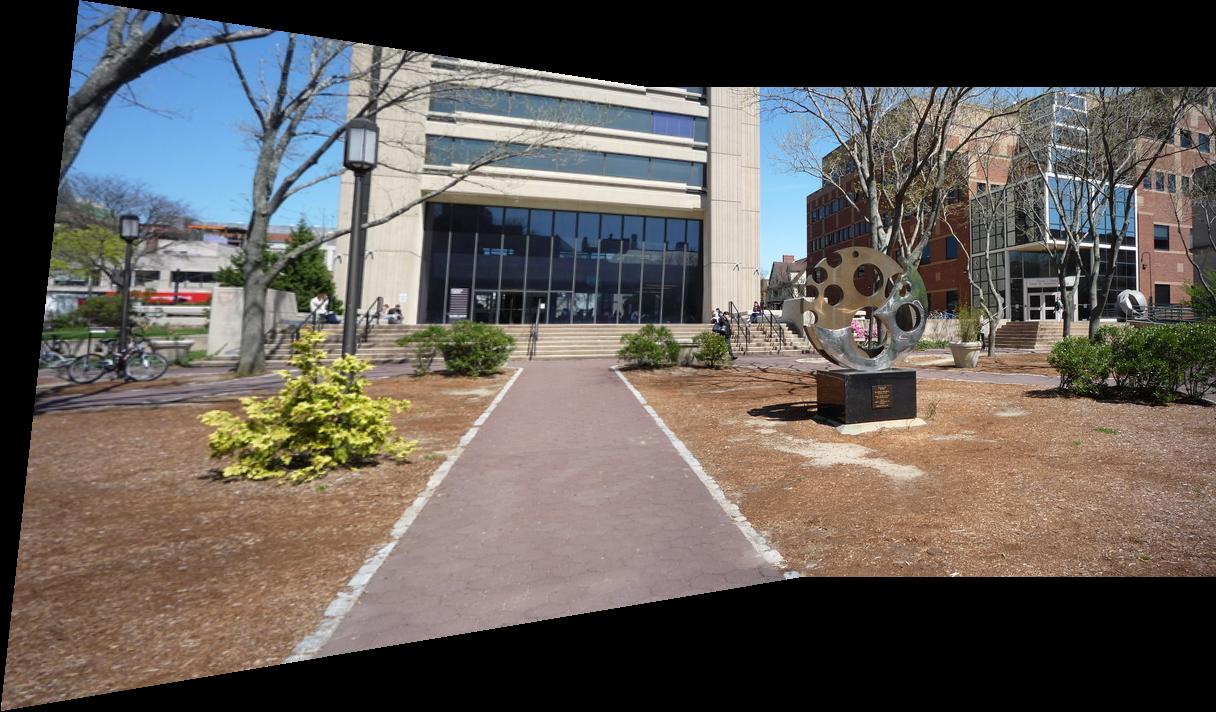
A graph cut hides all seams and ghosting effects
Results
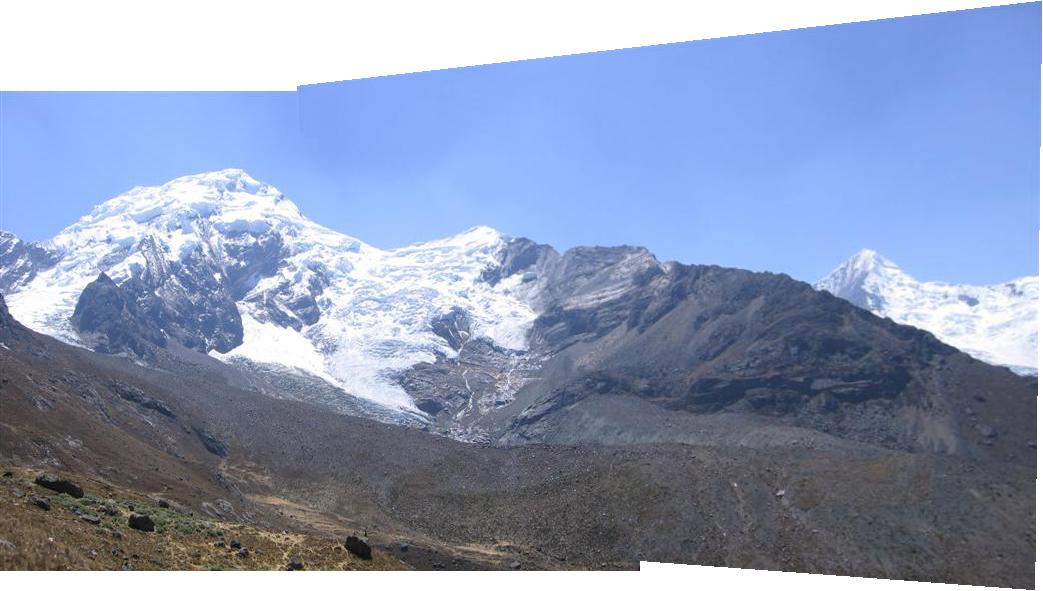
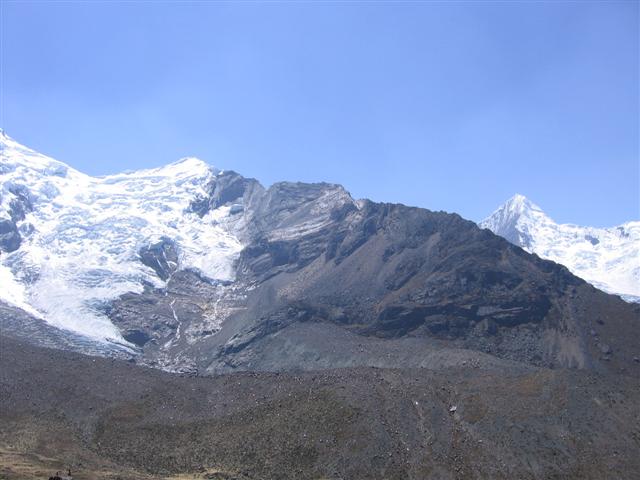
Here are my results on the provided images:
 Combined image |
|
Left image |
Right image |
 Combined image |
|
 Left image |
 Right image |
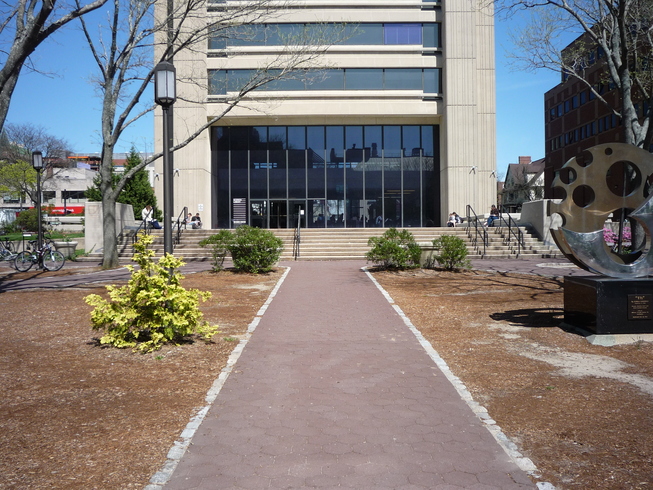
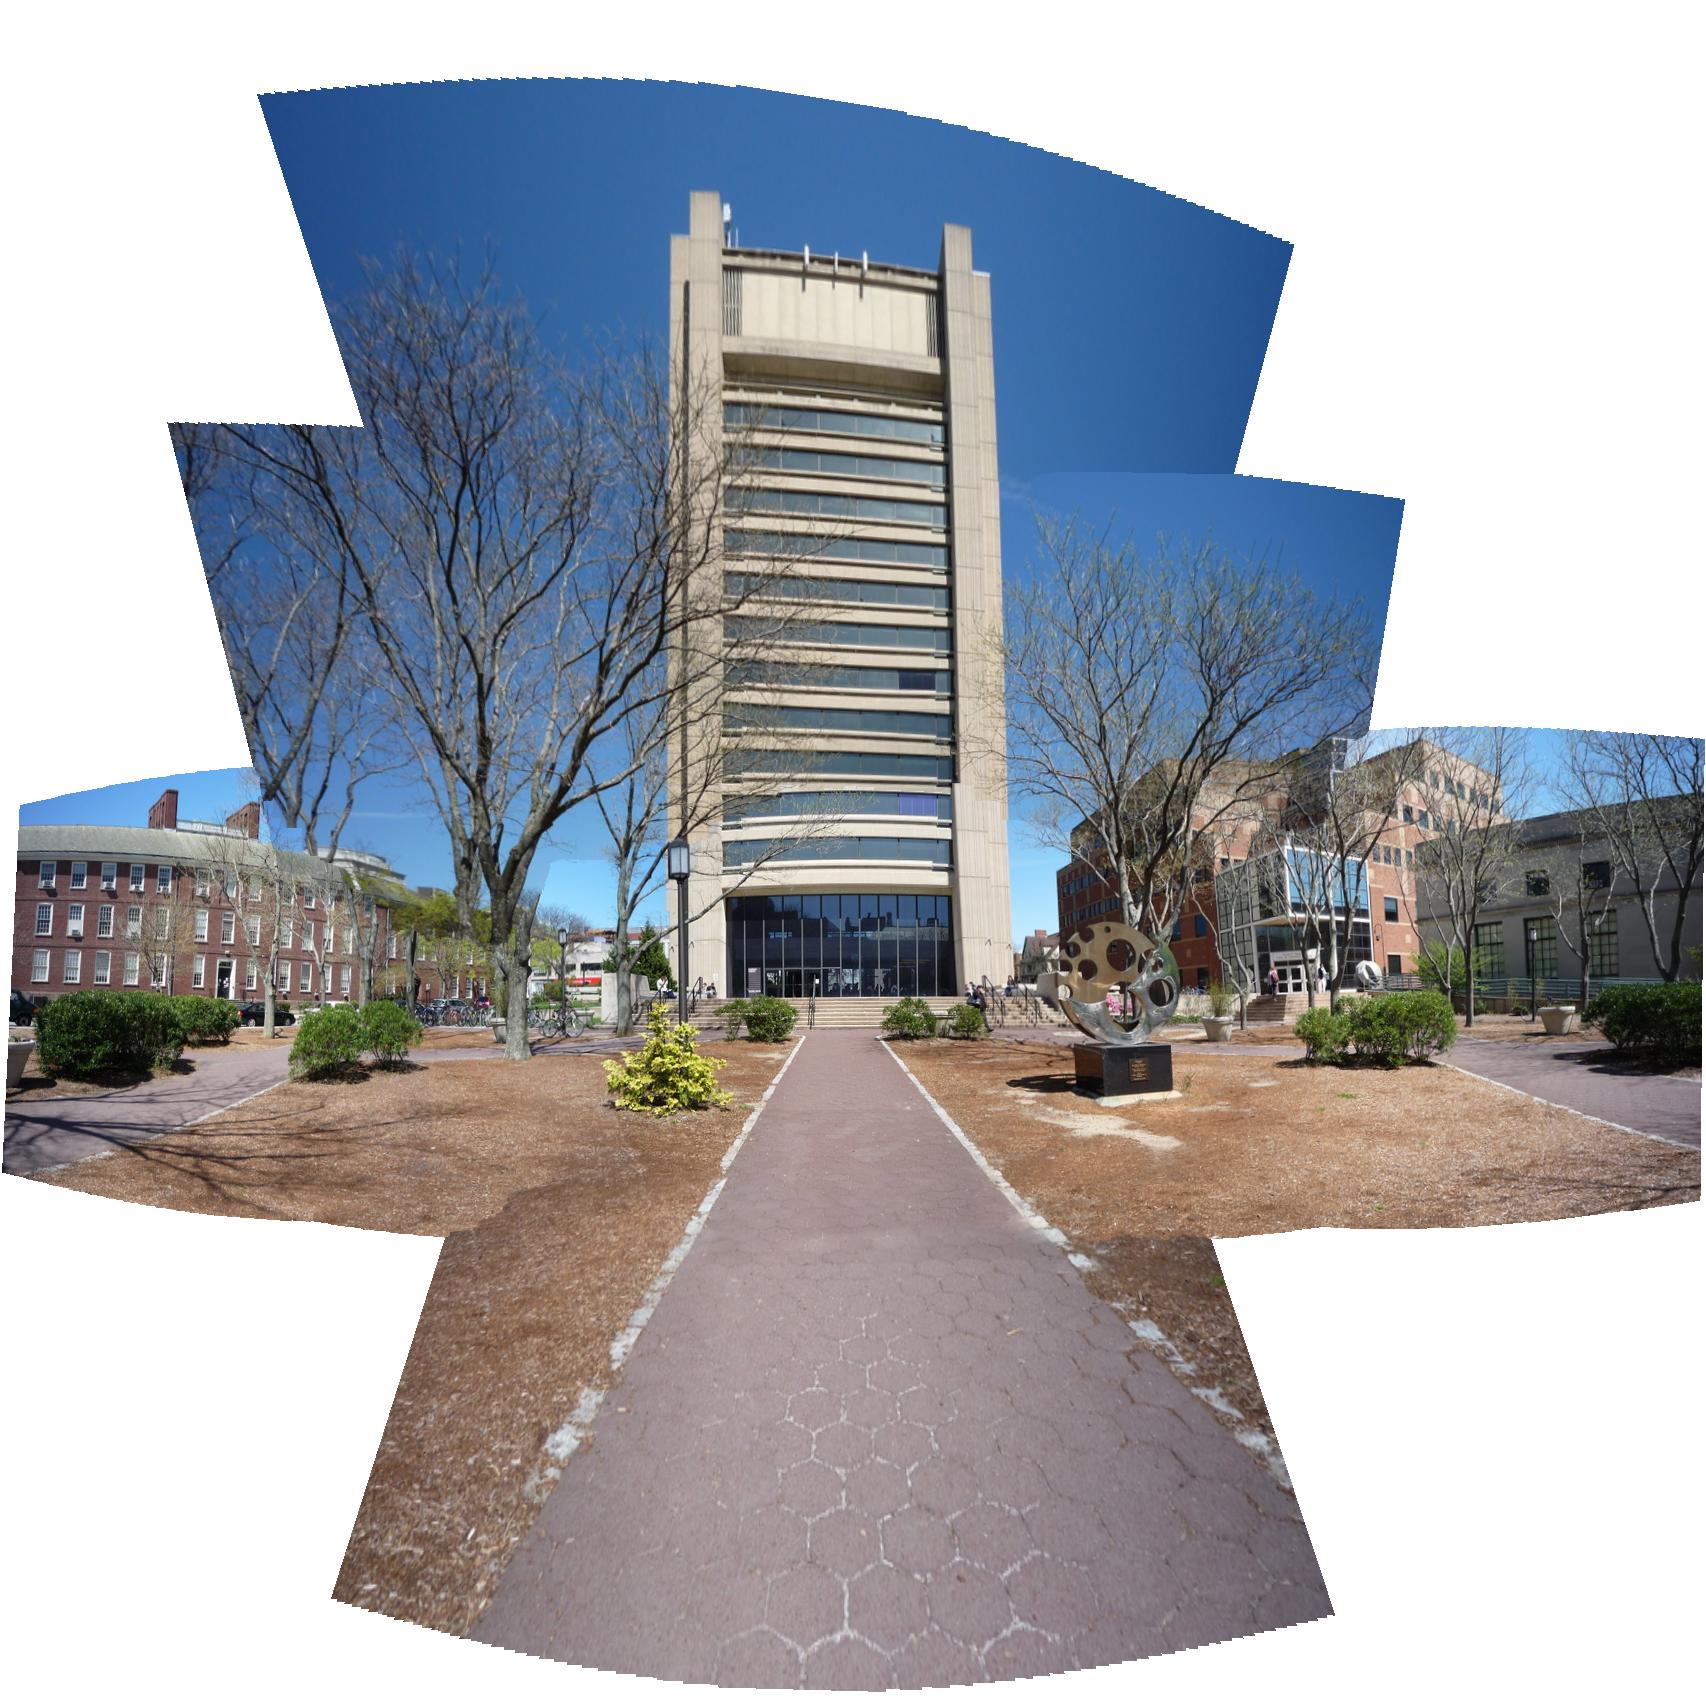
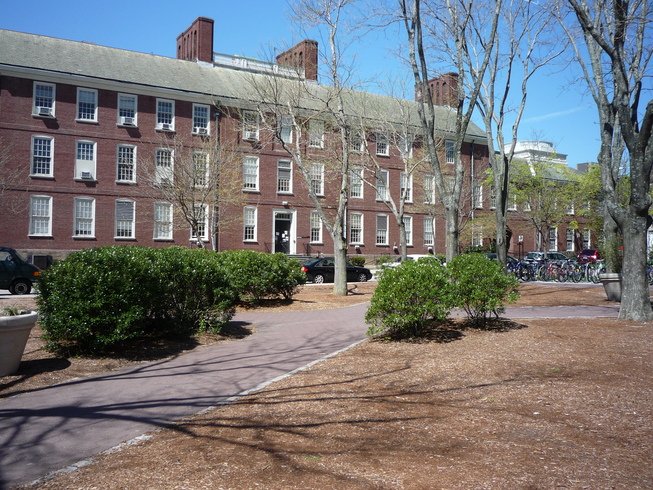
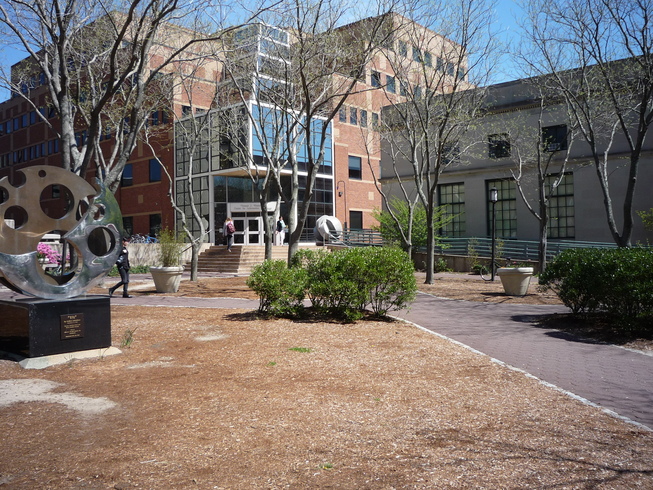
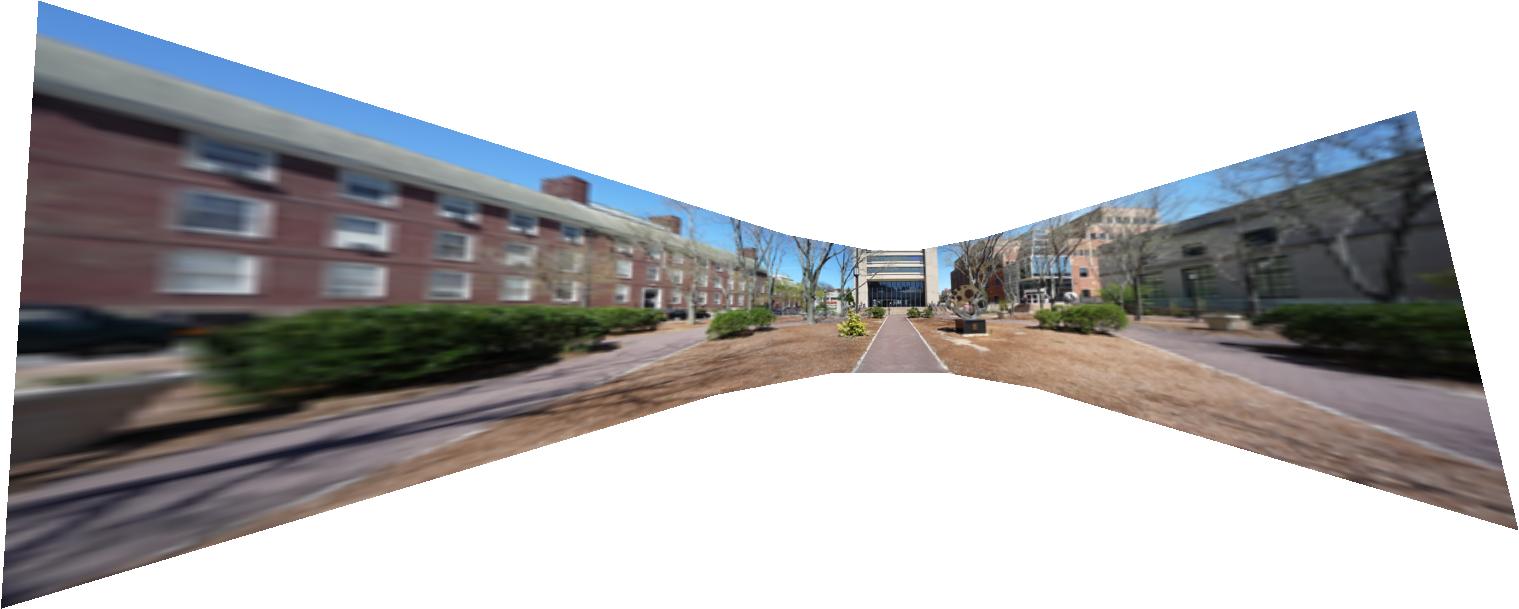
Here is a wide-angle view of the Sciences Library and the CIT (my photos):
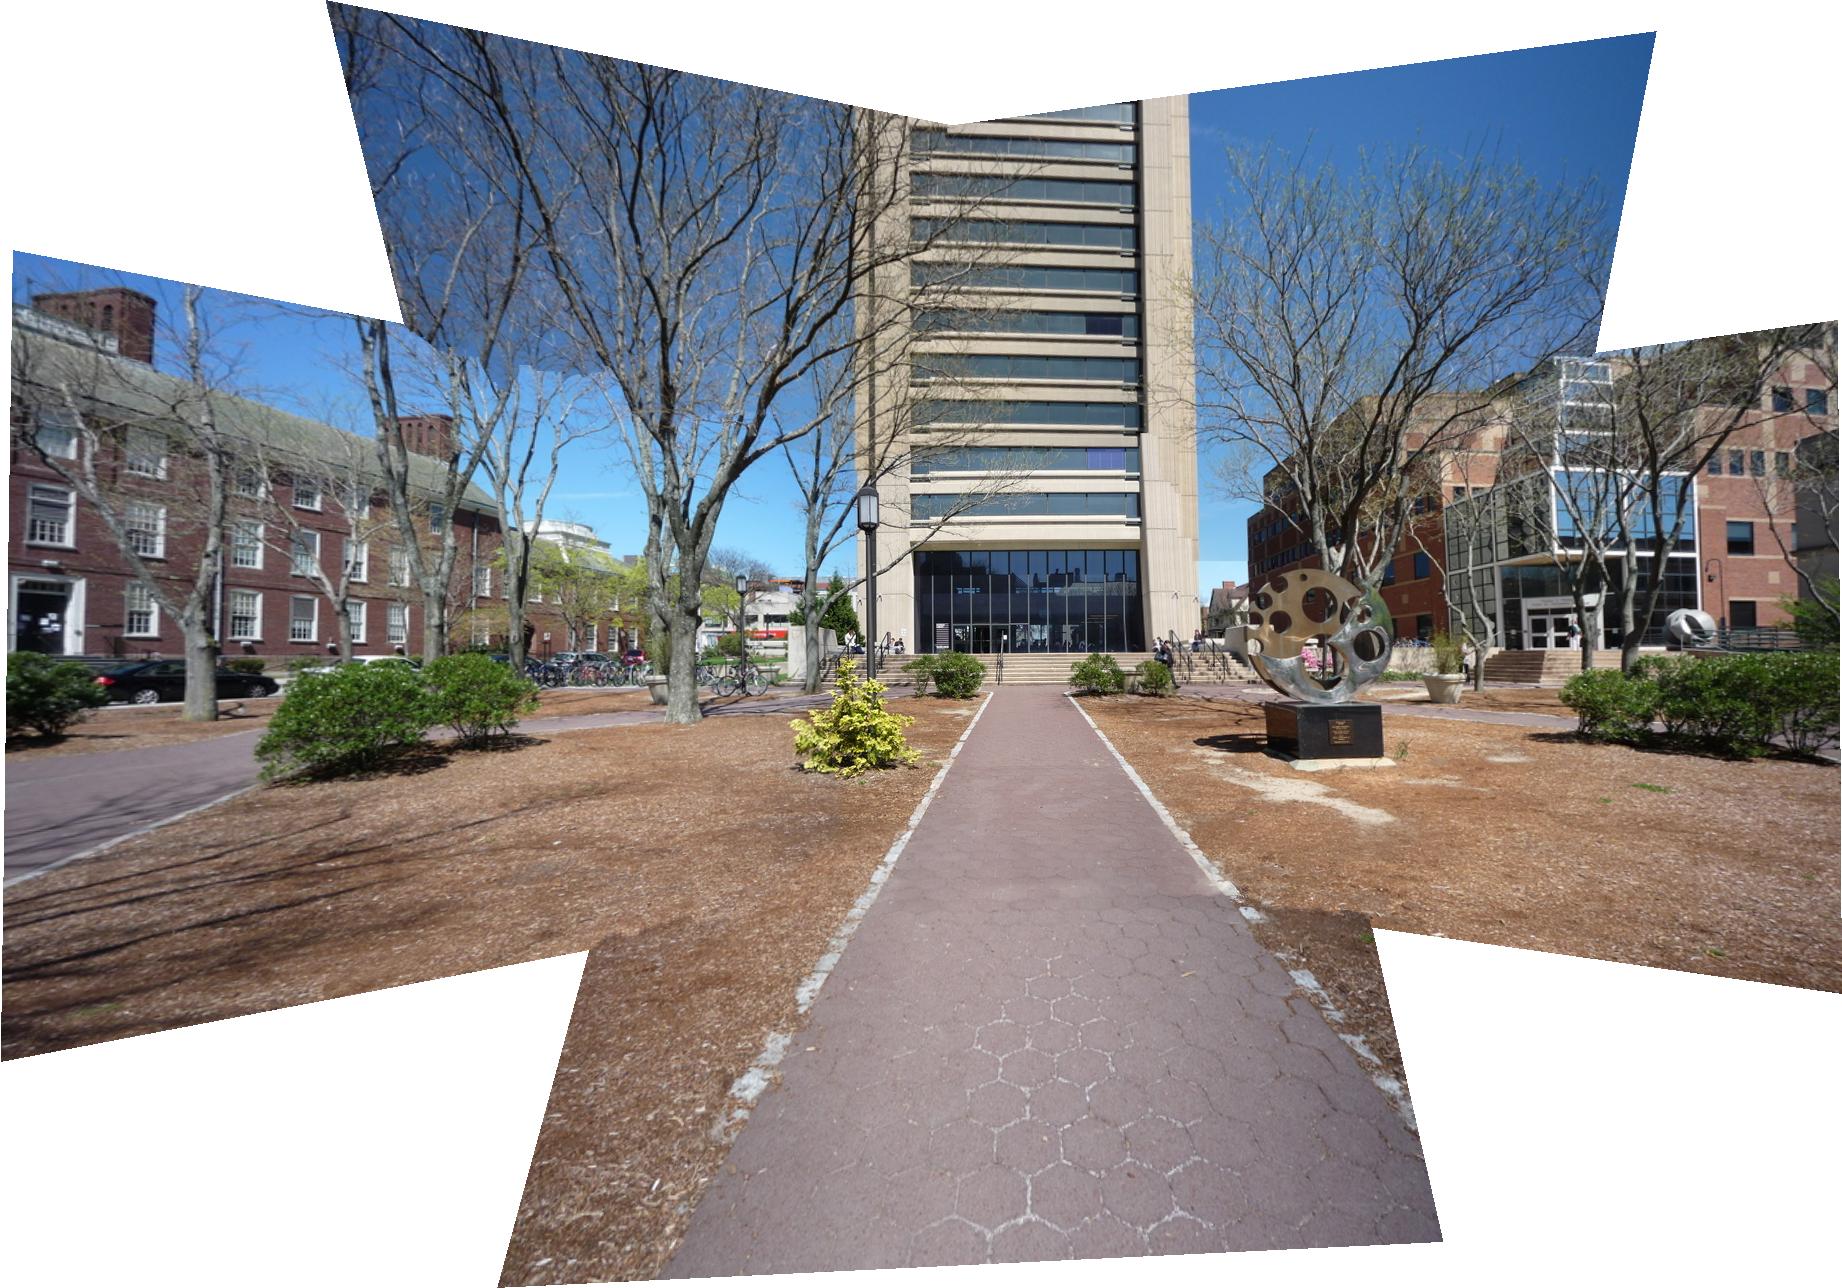 The SciLi and the CIT |
||
 |
 |
 |
 |
 |
 |
| The source images | ||
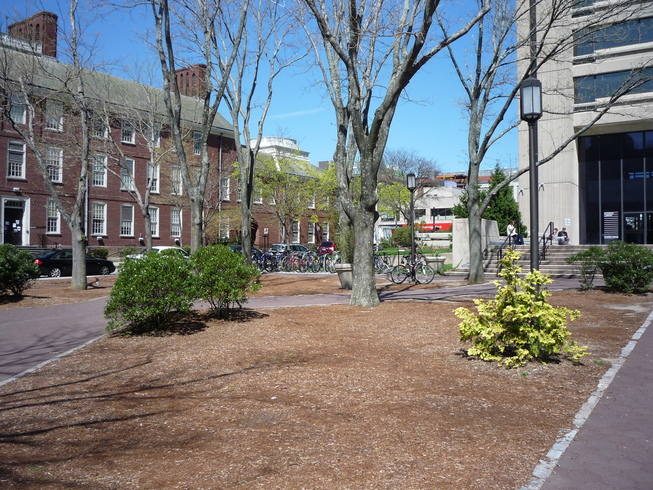
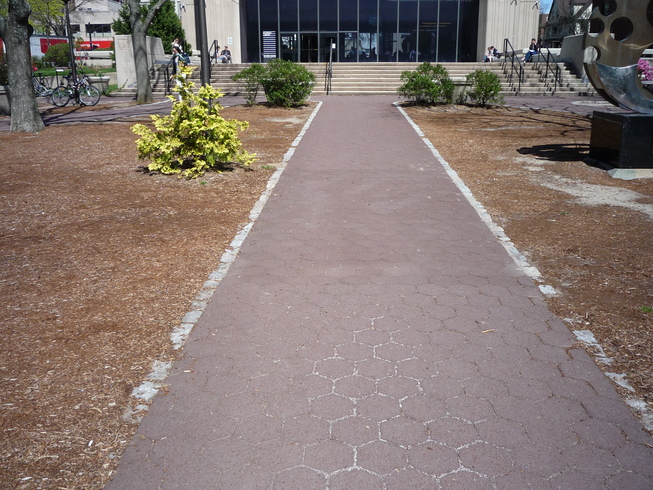
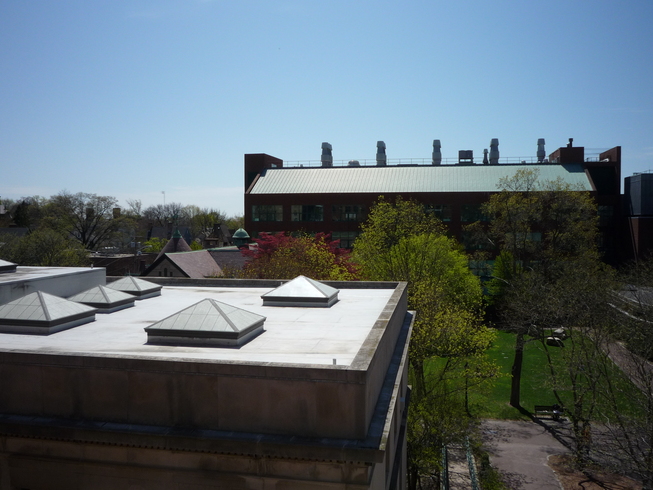
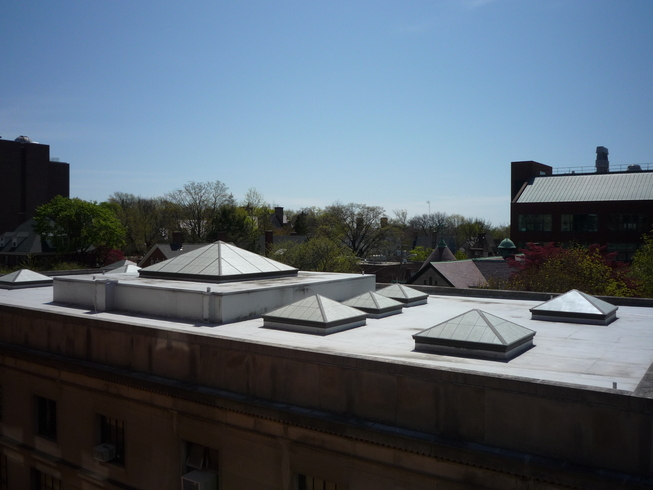
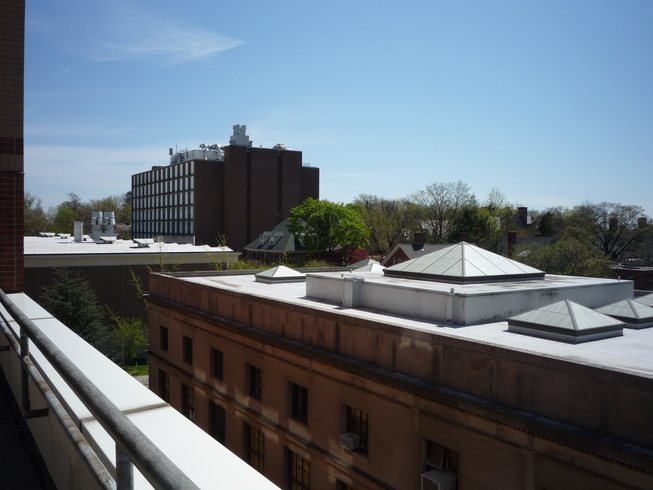
This is the view from the third floor CIT balcony:
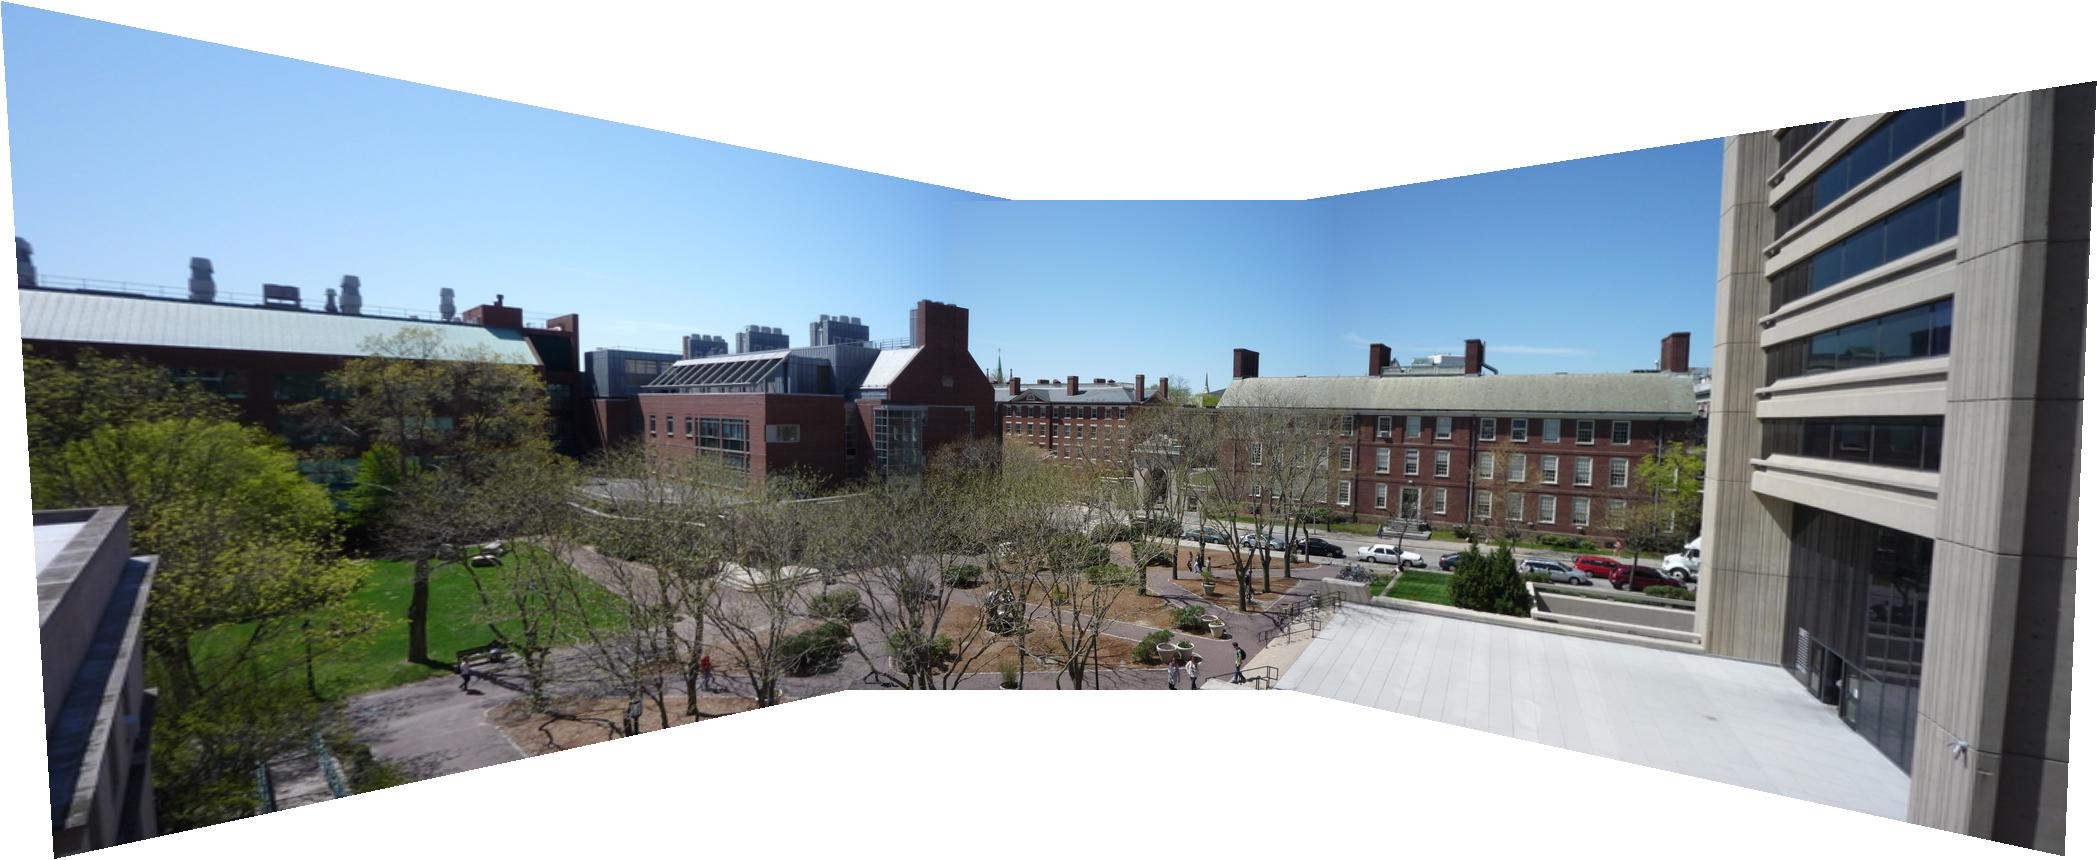 The view from the CIT balcony |
||
 |
 |
 |
| The source images | ||
Cylindrical Projections
Here's my attempt at cylindrical panorama. However, I used homographies instead of rotations and translations, so the panorama gets more warped towards the end on the right. The warping could be fixed by using only a rotation and a translation to relate each pair of images.
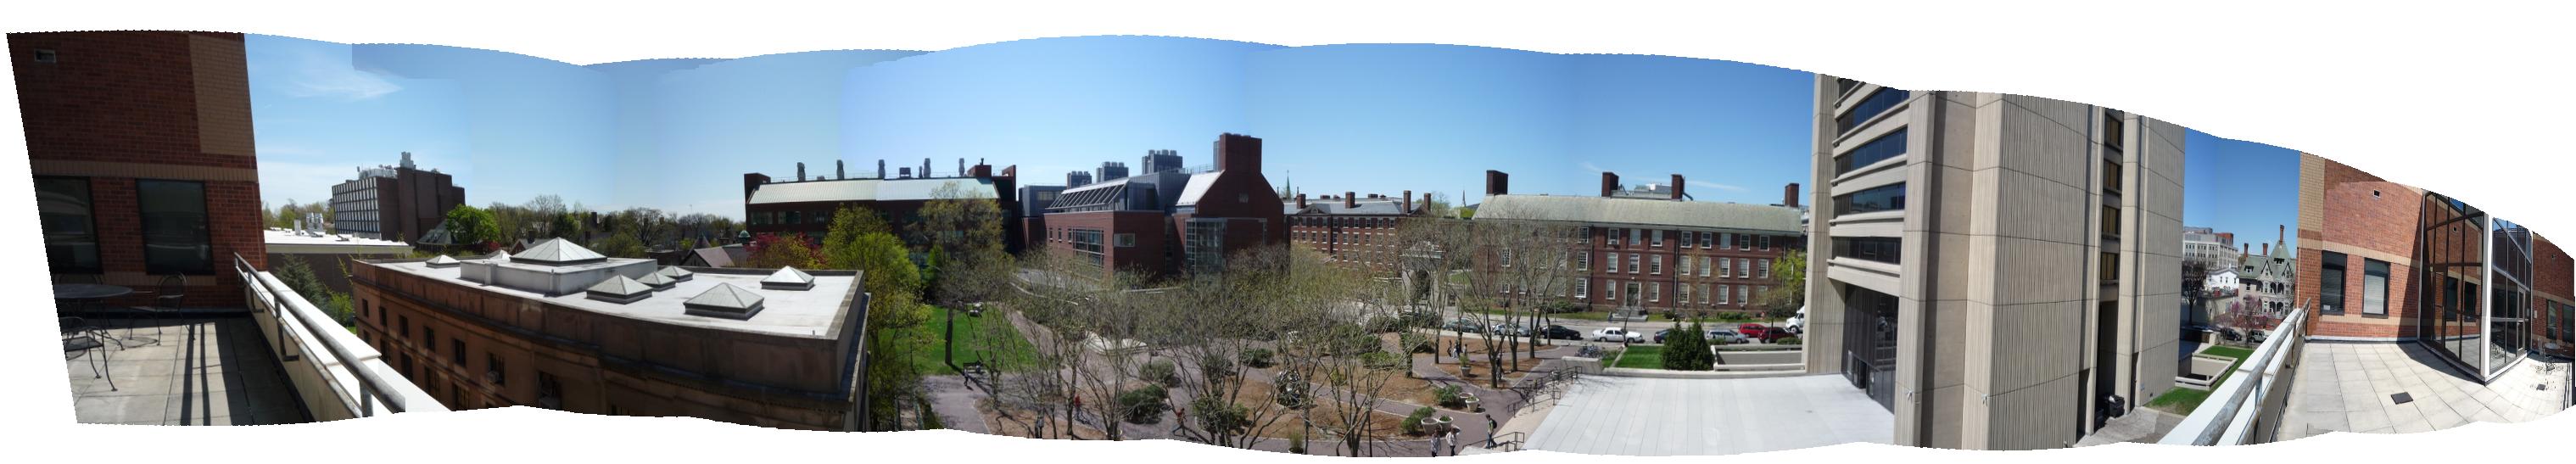 The 360 degree view from the CIT balcony |
|||
|
|
|
 |
 |
 |
 |
 |
 |
 |
 |
|
| The source images | |||
This is another "cylindrical" panorama, although all images are warped using the cylindrical projection for a picture level with the horizon, instead of the correct cylindrical projection for pictures taken looking up and down. I know this is incorrect but it worked out to something that looked nice, and allowed me to include more images.
 The SciLi and the CIT (wider view and more images) |
||
|
|
|
|
|
|
 |
 |
 |
| The source images | ||
A cylindrical projection is needed because a homography severely distorts images the further they are from the center. Below are the middle five images from the above panorama projected using homographies instead of cylindrical projections, to show this distortion.
The middle five images from the previous panorama using homographies instead