This tutorial should introduce you to many (but not nearly all) of the features of the code bubbles programming environment. By following it and playing with the environment you should get a feel of how the environment works and how it can be used.
You first should download the tutorial package. This includes the source code inside an Eclipse project. It is available here. This is a zip file and should be unzipped into a directory on your computer.
You should also download code bubbles.
To run the tutorial start code bubbles either by double clicking on the Jar file bubbles.jar that was downloaded or by running
java -jar bubbles.jar
in the download directory.
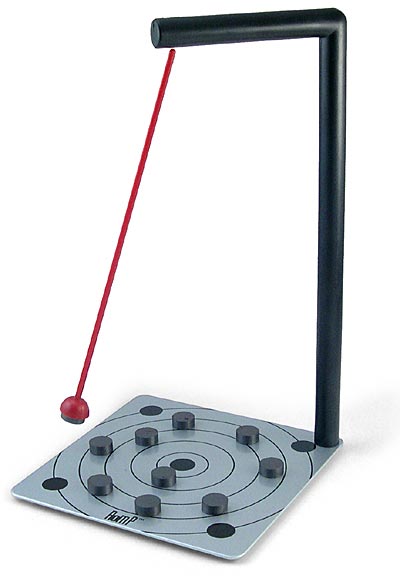
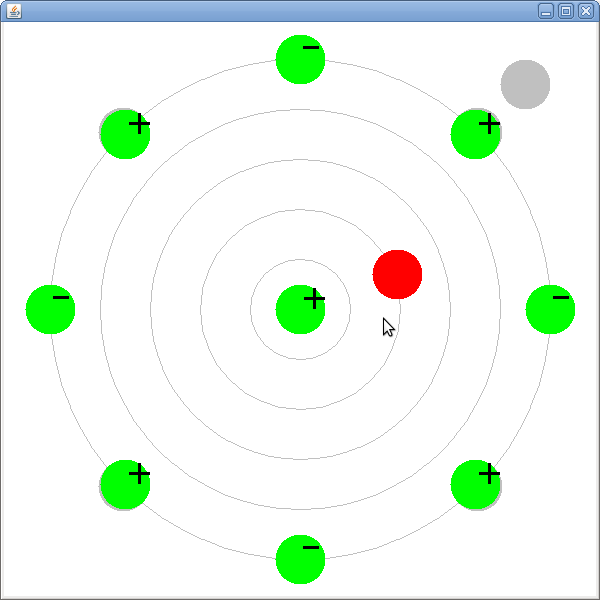
The code downloaded in the tutorial directory implements a little physics toy that consists of a pendulum with a magnet on its bottom handing over a platform where magnets can be placed:
The implementation takes an input file that contains the locations and orientations of the magnets on the base and then simulates the pendulum under the effects of gravity and the various magnets. The programs output looks like:
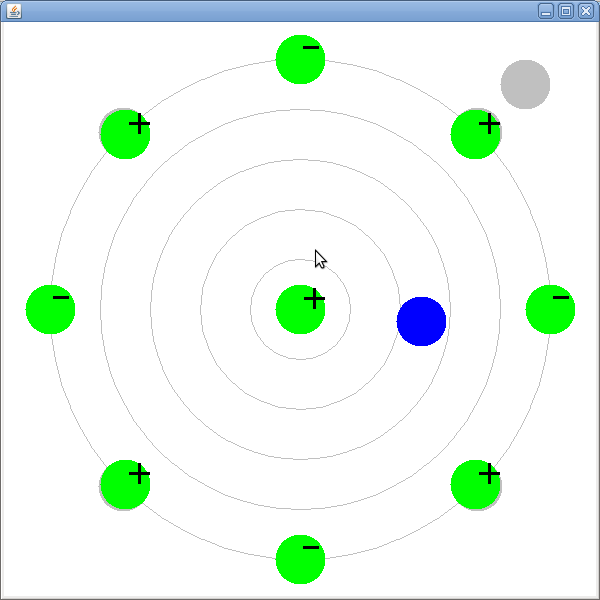
In this tutorial we are going to fix the program so that a) the pendulum is shown in red rather than in blue; and b) so that the polarity of the magnets (+ or -) is displayed correctly on the green circles.
When code bubbles starts you should get the splash screen (note that all bubbles images are displayed half size and some might differ from what appears on your display due to different window sizes and the fact that bubbles is still under development):
If this is the first time you run code bubbles, you will get a dialog box (in the upper left of your display) asking you to locate your Eclipse installation directory. This is the directory where eclipse is installed and should include the eclipse binary (eclipse, eclipse.exe, eclipse.app, ...) as well as a plugins (or dropins) directory. Once this is identified, you can click on Install Code Bubbles which will install a small plug-in into Eclipse. We suggest you do not select Run Eclipse In Foreground and do select Automatically Update Bubbles. When done, click OK.
Next you should get a dialog box (in the upper left of your display) asking you to select the Eclipse workspace. Here you should enter the path of the directory containing the files unzipped from the tutorial download. Unless you always want to run the tutorial, you should make sure that Always Ask For Workspace is checked.
If this is the first time you are running the system on a particular workspace, code bubbles may need to update its JavaDoc cache. By default it will go to the standard java web site and download all the index files. This can take some time, especially on a slow connection. The JavaDocs that should be accessible for a project and their sources are specified in a resource file. All the resource files are kept in ~/.bubbles where ~ represents you home directory.
After you have gone through the various dialogs you should get an initial code bubbles display:
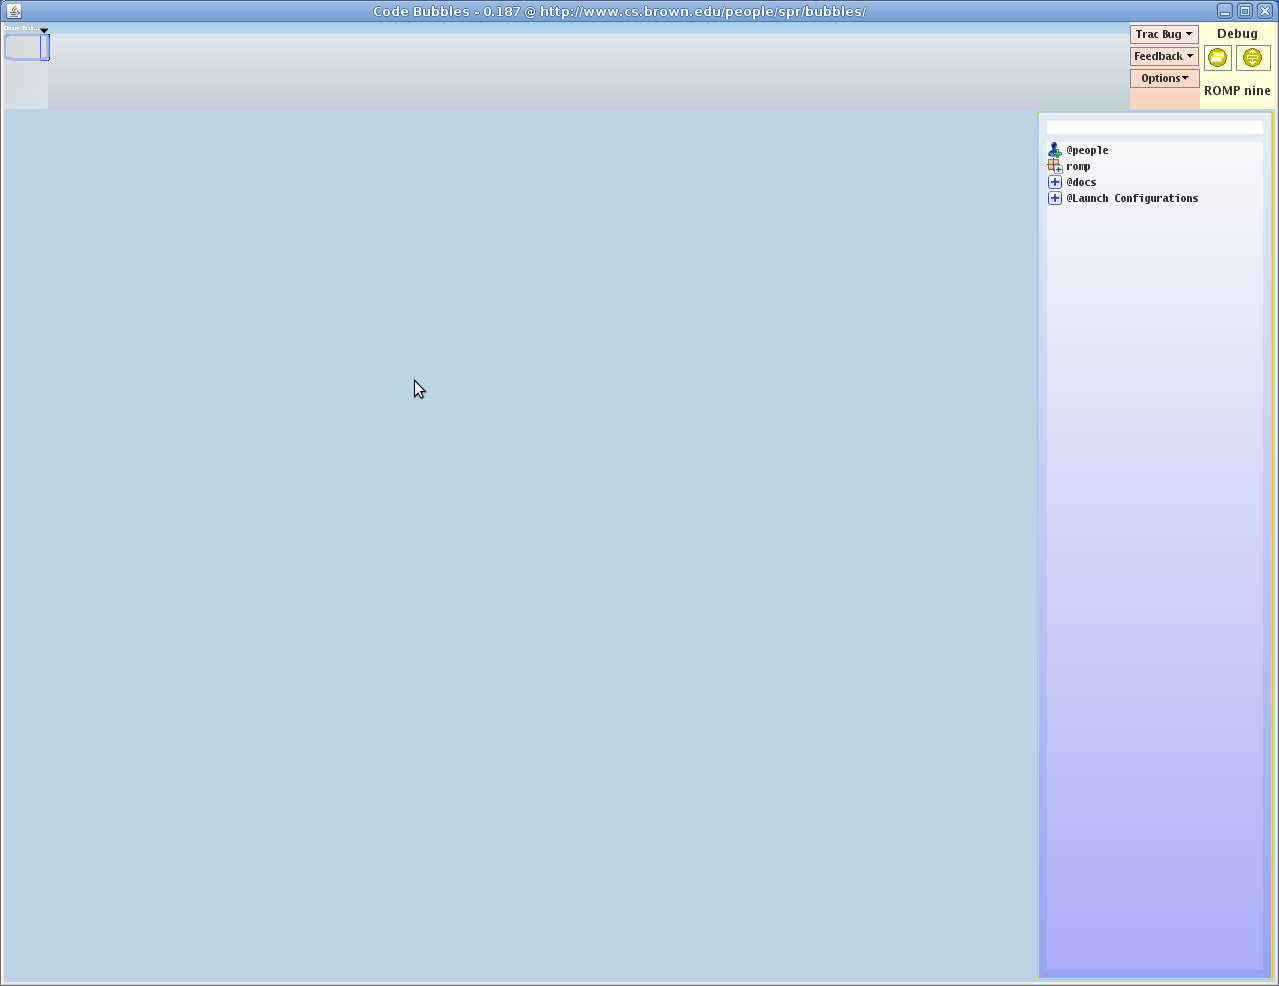
The blue bar at the top (below the window title bar) is an overview bar. It contains labels for working sets. You can right click on this to get various working-set related options. Below this is a larger gray area. This is the overview bar. Your work space in code bubbles is virtually infinite (this area will grow as needed). The blue rectangle in the upper left of this area shows where you currently are. It can be moved with either the left or right mouse button.
To the right of this area are two menu areas. The first, in pink, has buttons for reporting bugs and suggestions as well as for bringing up an options bubble to customize the display. The second, in yellow, controls access to the debugging panels. The left button here switches between the current (main) display and the debugging display. The right hand button lets you start a new debugging area. (You can have any number of debugging areas, either active or old, open at once.) Right clicking on this button is one way of selecting the configuration you want to debug.
The remainder of the screen is the active bubble area. This is where your bubbles are placed and where most of the work is done. The initial display comes with one bubble, on the right, the package explorer. This is a combination list and search panel for code, documentation, people (chat targets), and launch configurations.
If you moved the working area around in the overview bar, you might have notices that the package explorer bubble remained at the right of the screen. There are two main types of bubbles that can be displayed. Normal bubbles are placed in the large work space area and you can pan to or from them. Fixed bubbles are pinned to the current display space and move with you as you move that space. The package explorer is an example of a fixed bubble. To be confusing, code bubbles will sometimes call these floating bubbles (they float over the work space area).
The first task we want to perform is to change the color of the displayed pendulum from blue to red. While we could do this by reading all the code and understanding how the romp program works, we really don't need to. We need to find out where in the program the color is set to blue and just change that setting.
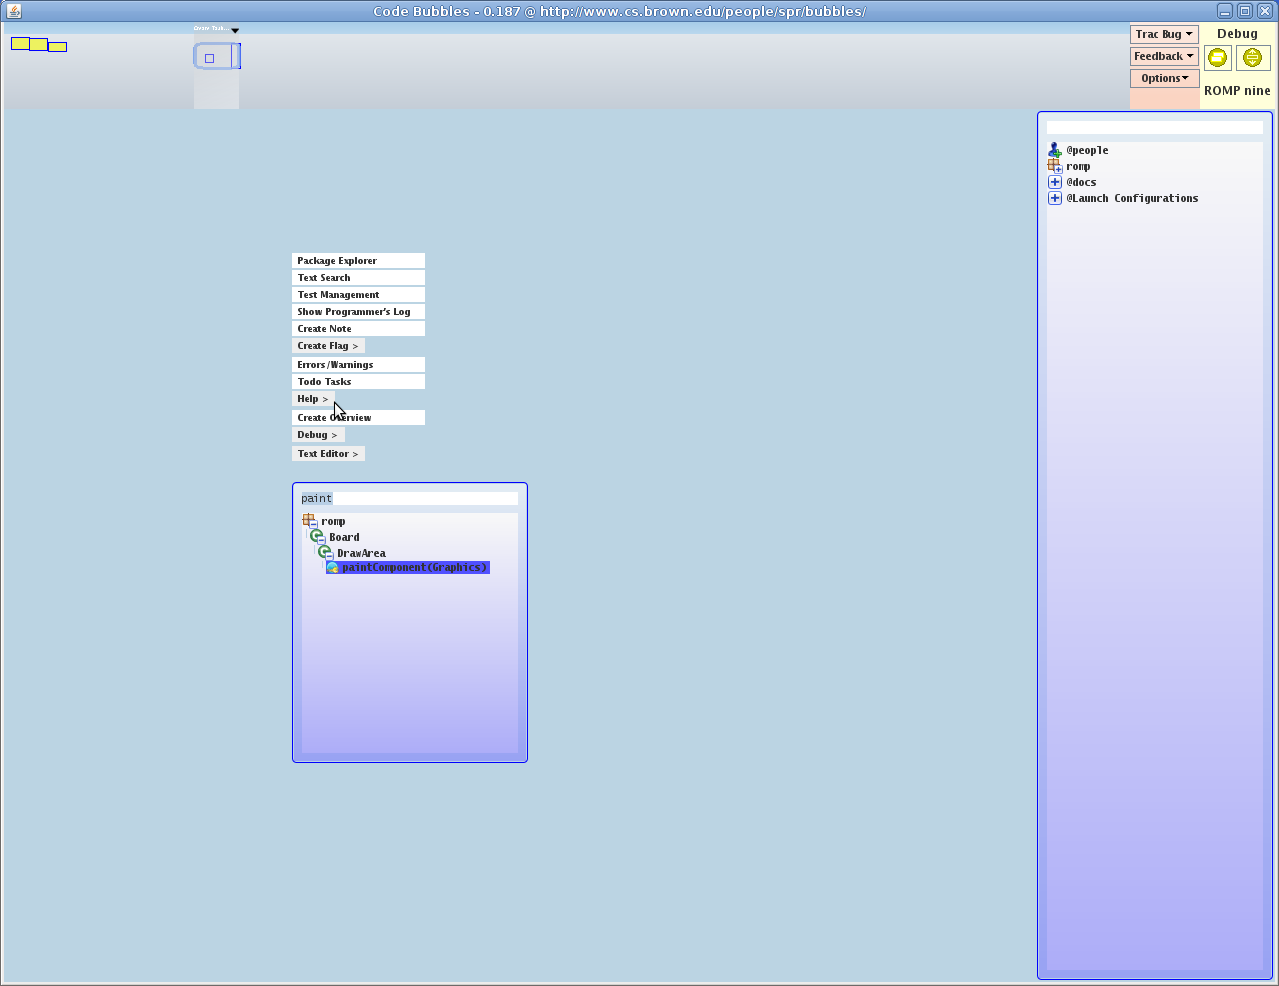
With some knowledge of Java, we know that the drawing is done in routines called paint (or paintComponent). Therefore, we will start by finding all such routines in the system. Move the mouse into the large blue empty space of the work space and right click. You will get a code search box similar to the package explorer. (Control-right click will give you a search box on documentation; shift-right click will give you a search box containing both code and documentation.)
In the top of this box, the search pane, enter "paint". This will select all methods in any user class that have "paint" (ignoring case) as either part of their name, their class name, or their argument types. If you wanted to restrict "paint" to be in the method name, you could enter M:paint. (Similarly C:paint would require "paint" to be part of the class name and A:paint would check for it in the argument types.) The search string actually consists of multiple items separated by spaces. The display is restricted to those elements that match all the items listed in the search string. Once you get used to it, this search panel provides a fast and convenient way of finding code in your system. Note that the package explorer also has a search typein pane at the top. It behaves much the same way.
Once we enter "paint", we get the display:
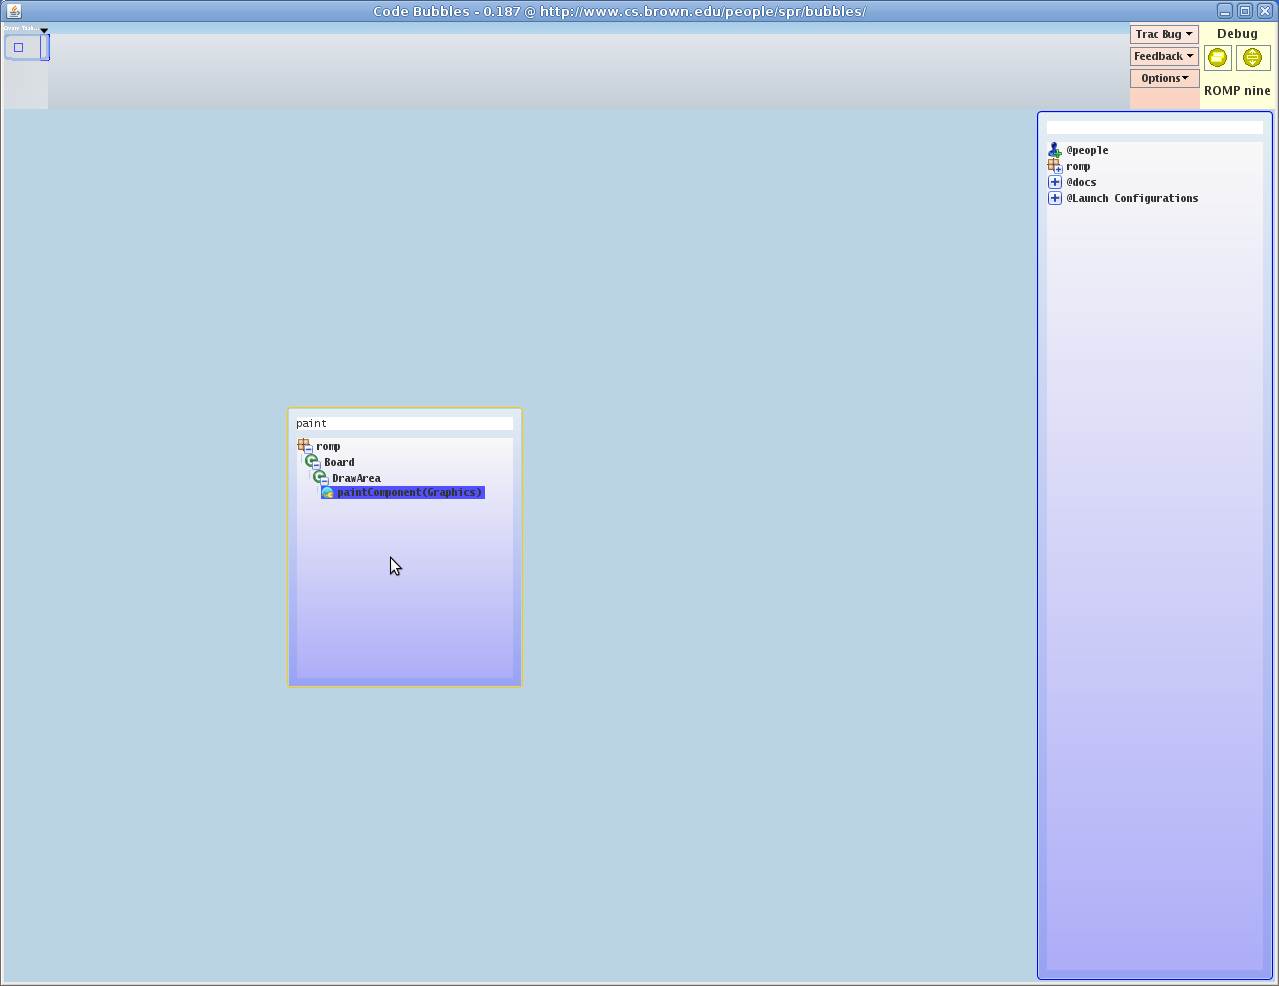
There is only one matching routine and it is highlighted. We select this routine to bring up the corresponding bubble. This selection can be done either by hitting 'Enter' as part of the search, by clicking on the selected item, or by dragging the selected item to the bubble area. Note the last option leaves the search box up so it can be used to select another item. Assuming you hit enter to end the search, you should get a display like:
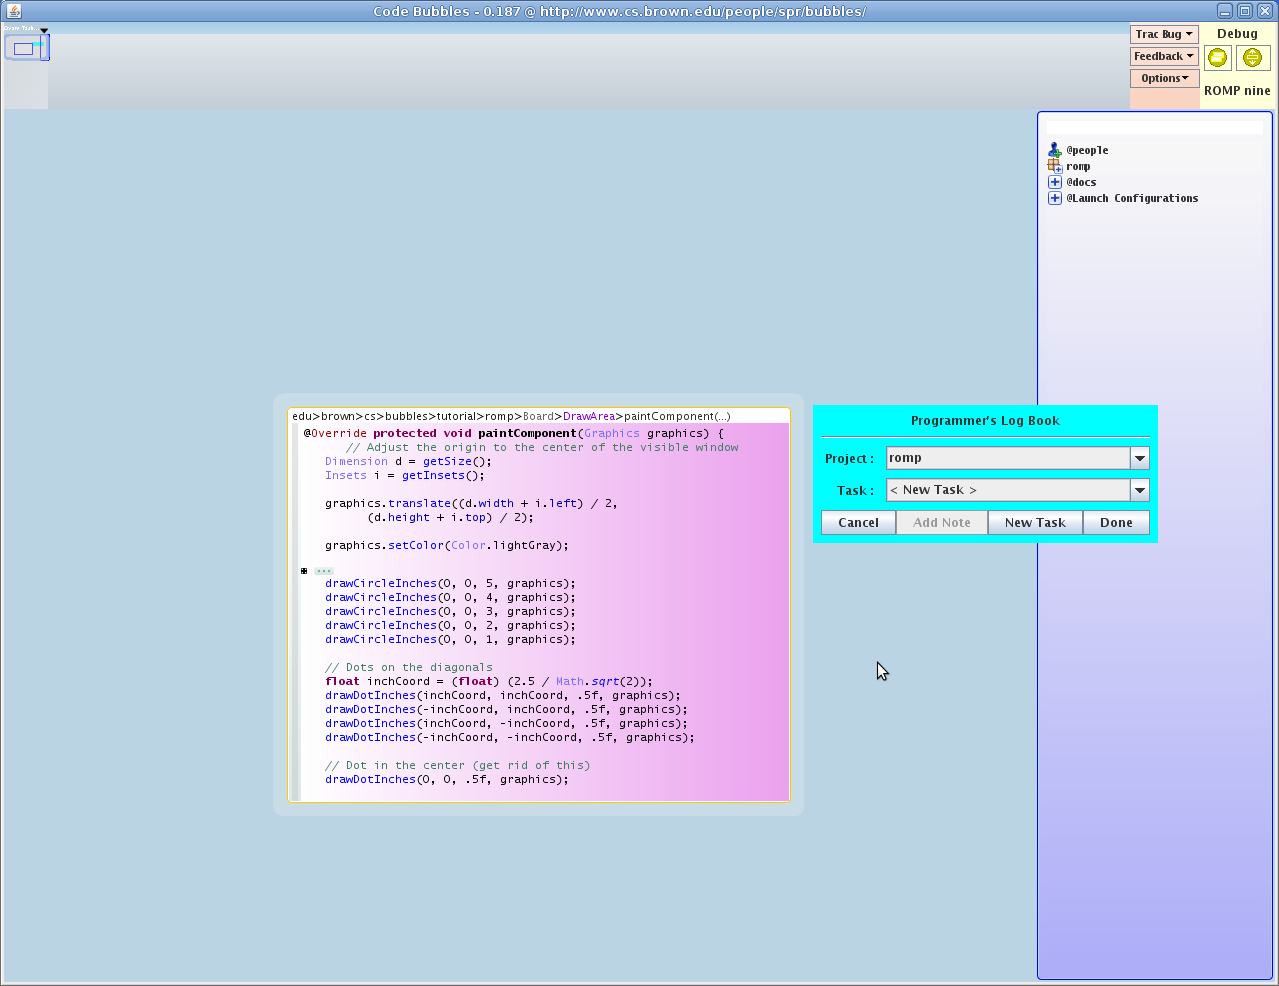
The window in the center is the code for the paint method. The window next to it, essentially a dialog box, is part of the code bubbles programmer's log book implementation.
Bubbles now maintains a "programmers log" (similar to a scientific log or note book) for each workspace. This is designed to help the programmer by reminding them what was done and how it was done. It can be particularly useful if multiple programmers are working on a project and one wants to understand changes another made. The log can be joint (i.e. shared among programmers) or separate (per-programmer). It splits the work into tasks and lets the programmer add notes and attachments describing what they are doing. In addition it collects information automatically as to what methods and classes are viewed and edited. A query interface is provided to facilitate directed access to the log. You can enter a task here by hitting New Task and typing in the appropriate information. Alternatively you can just cancel. (This feature can be disabled completely if desired.) Hitting F2 at any time will bring up a dialog for managing the log.
The code window for the paint routine is a bit large. By default, code bubbles will only display about 30 lines of the program. In general, the system will attempt to include the whole method, and will use elision if it can. Here you can see that a comment was elided about 1/3 of the way down. You can click on the ellipses or on the little box to its left to unelide it or reelide it.
There are several ways one can view the rest of the method. One is to simply enlarge the bubble. Move the mouse to the top or bottom (or a corner) of the bubble and use the left mouse button to change the size. While it was not needed here, code bubbles will also enforce an initial maximum width for a bubble and will reflow lines that are longer in the display (it will not actually reformat the source however). If you resize the bubble to be narrower, you can see this.
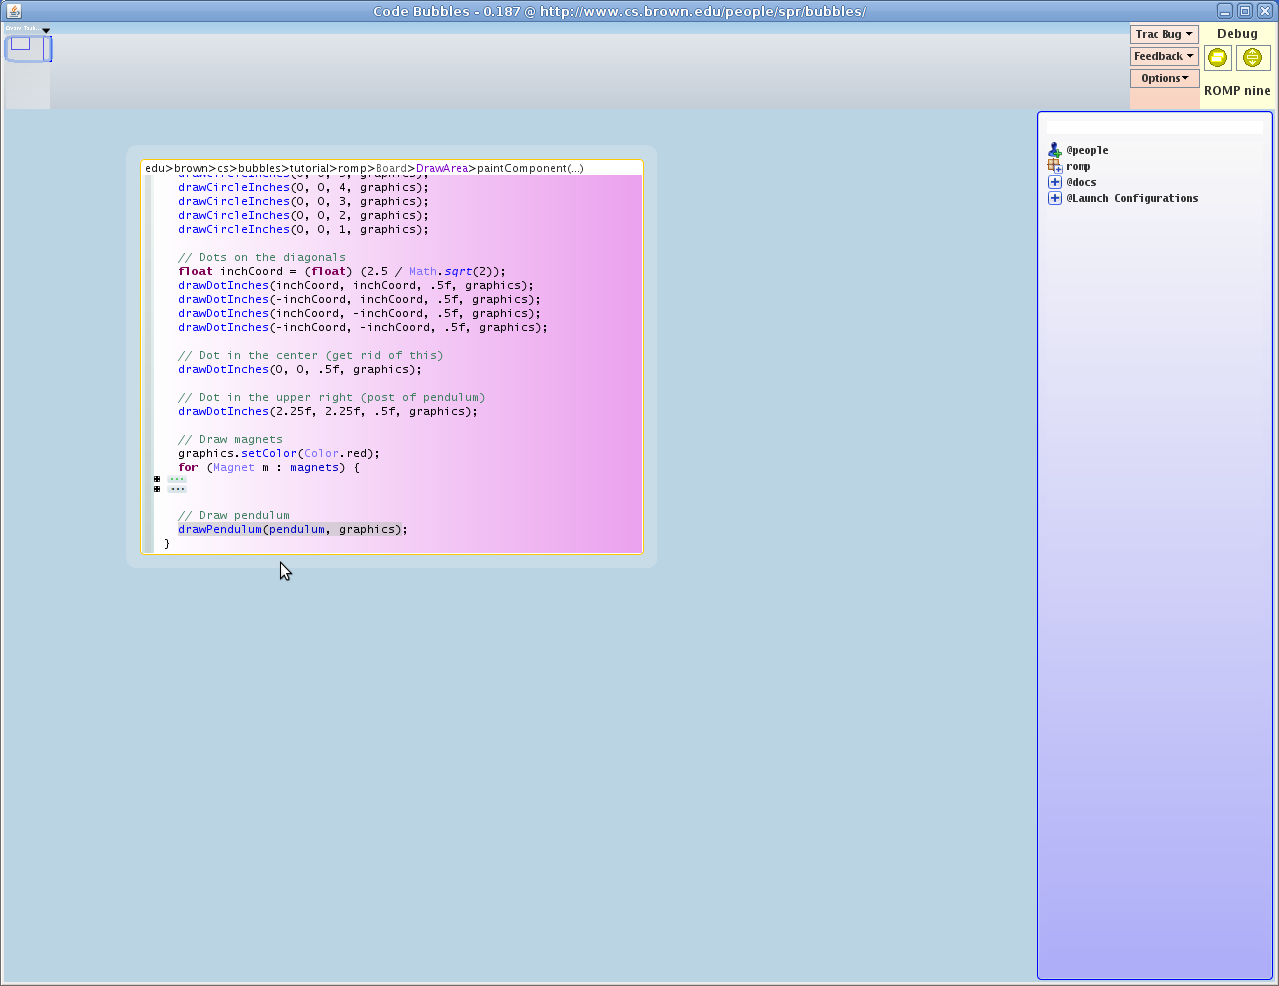
Another approach is to scroll the bubble. Code bubbles will provide a scroll bar if the size of the bubble is more than about 1.5 times the display area. Otherwise, scrolling can be done using the scroll wheel on the mouse (or equivalent) or by just moving the cursor toward the off-screen region (using the arrow keys for example). Here we scroll the bubble to find the call to the method that draws the pendulum and select that call by moving the cursor onto it:
We next want to view that function. Now that we know its name we could right click and bring up a search box and enter the name. Alternatively we could use the package explorer. In this case, however, we can just hit F3 (goto implementation/definition). While Eclipse uses F3 as goto definitiion, bubbles extends this to goto all implementations of a method if the method is virtual and has multiple implementations. This is done using a bubble stack which we will see later in the tutorial. In this case, however, there is only one implementation. Hitting F3 thus simply brings up a new bubble for the referenced method. The bubble will come up on a line with the source line. You can use the right mouse button to move it to any place on the screen you like. (You can even use the right mouse button to move it any place in the bubble area by clicking on it an dragging it in the overview bar.)
The bubble comes up initially with a red border, indicating that this is a tentative placement which can be changed for a few seconds. It also comes up with a yellowish background to make the new bubble stand out on the display. The code bubbles philosophy is that bubbles should not overlap. (Note this doesn't apply to fixed bubbles such as the package explorer.) If a new bubble comes up in a location where it would overlap other bubbles, those bubbles will move out of its way. The red border and the inherent delay provide the programmer with the means for better organizing the display.
After moving the bubble up slightly you should get a display something like:
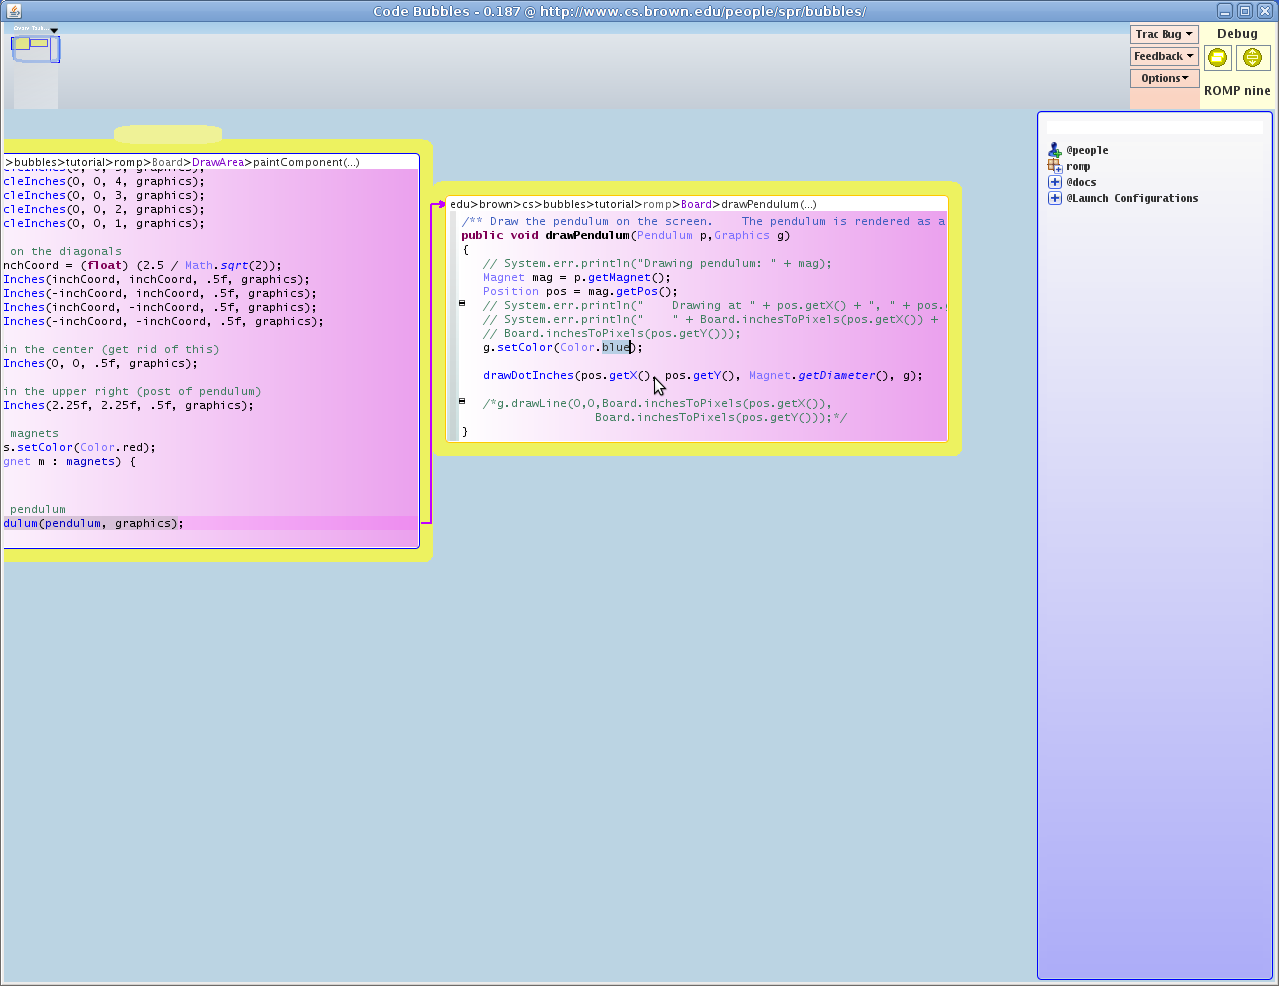
Note that the two bubbles are encased in a yellow background. In general, when bubbles get close enough to each other, they are considered to form a group, and a colored background is used to indicate the different bubbles in the group. Different groups will generally have different color backgrounds. Groups can be useful. They can be labeled (click on and type in the little tab on the top of the group). All the bubbles in a group can also be moved as one by right dragging the colored background.
Note also that the two bubbles are connected by a directed arc. Such arcs show the relationship between the bubbles as they are created. Programmers can add new arcs or remove arcs by shift-dragging with the right mouse button. (Control dragging can also be used -- it actually creates arcs for any calls between the two bubbles, possibly creating the necessary intermediate bubbles.)
Reading the drawPendulum routine, we find where the color is set to blue and, as shown in the above diagram, select the string "blue". The code bubbles are fully functional editors, with most of the features (and key mappings) of the Eclipse editor. A complete list of the keys as a csv file can be found here. In this case, we want to replace "blue" with "red", so we just select the one and type in the other. Note that undo is supported at the bubble level rather than globally.
To complete this change, we save the method using control-S (command-S on the mac). This actually does a save all. If your machine is slow, you might notice a status display on the lower left of the screen indicating how the save and resultant compilation are progressing. Now we are ready to test our change.
To start testing, we want to bring up the debugger. To do this click on the right-hand button in the debugger menu at the top right of the display. This should bring up a debugger for the configuration ROMP nine (romp with nine magnets on the base):
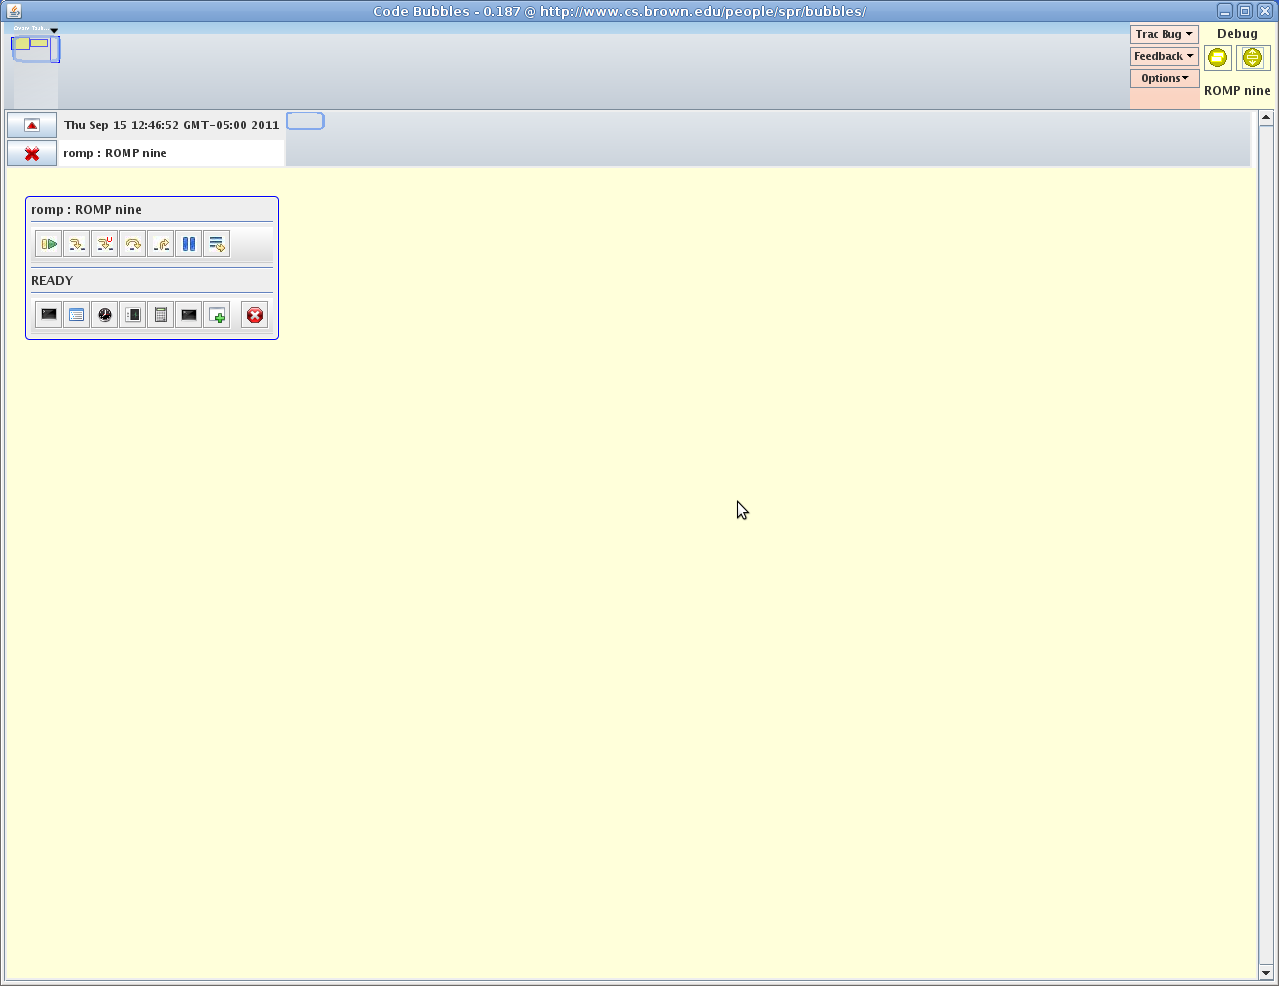
Debugging is done in a separate bubble area in what we call the debugging channel. This is designed to support multiple debugging sessions, each with its own bubble area. This lets the programmer debug multiple programs (or multiple configurations) in parallel; it also proviides a means of preserving past debugging sessions (including their history which we will get to), so they can be compared with the latest session. (Debugging channels can also be easily reused.) The debugging channels are controlled by the scroll bar on the right and the buttons on the upper left of the debugging channel. Try clicking on the debug button at the upper right a second time. You see that you now have two debugging sessions, each half size. The top button in the channel can be used to make that channel full size. The bottom button can be used to remove the channel. Remove the extra debugging channle by clicking on this button.
The debugger is controlled by the launch control bubble in the upper left of the bubble area. By default this is a fixed bubble so that the controls are always present while debugging. The top row of buttons controls the debugger. These are similar to those in Eclipse except for the third one which is tagged "Step into user code". This is equivalent to"Step Info" except that the debugger will step over system routines. The bottom row of buttons control the session. Click the first button brings up a terminal window. Click the second to bring up a thread status window. Click the third to bring up a history window. These are all fixed windows, but you can right click on them to unfix them. Once you do that, click on the play button to start the debugger session. After some time spent ensuring the code is saved and compiled, the program should start running and you should get a display like:
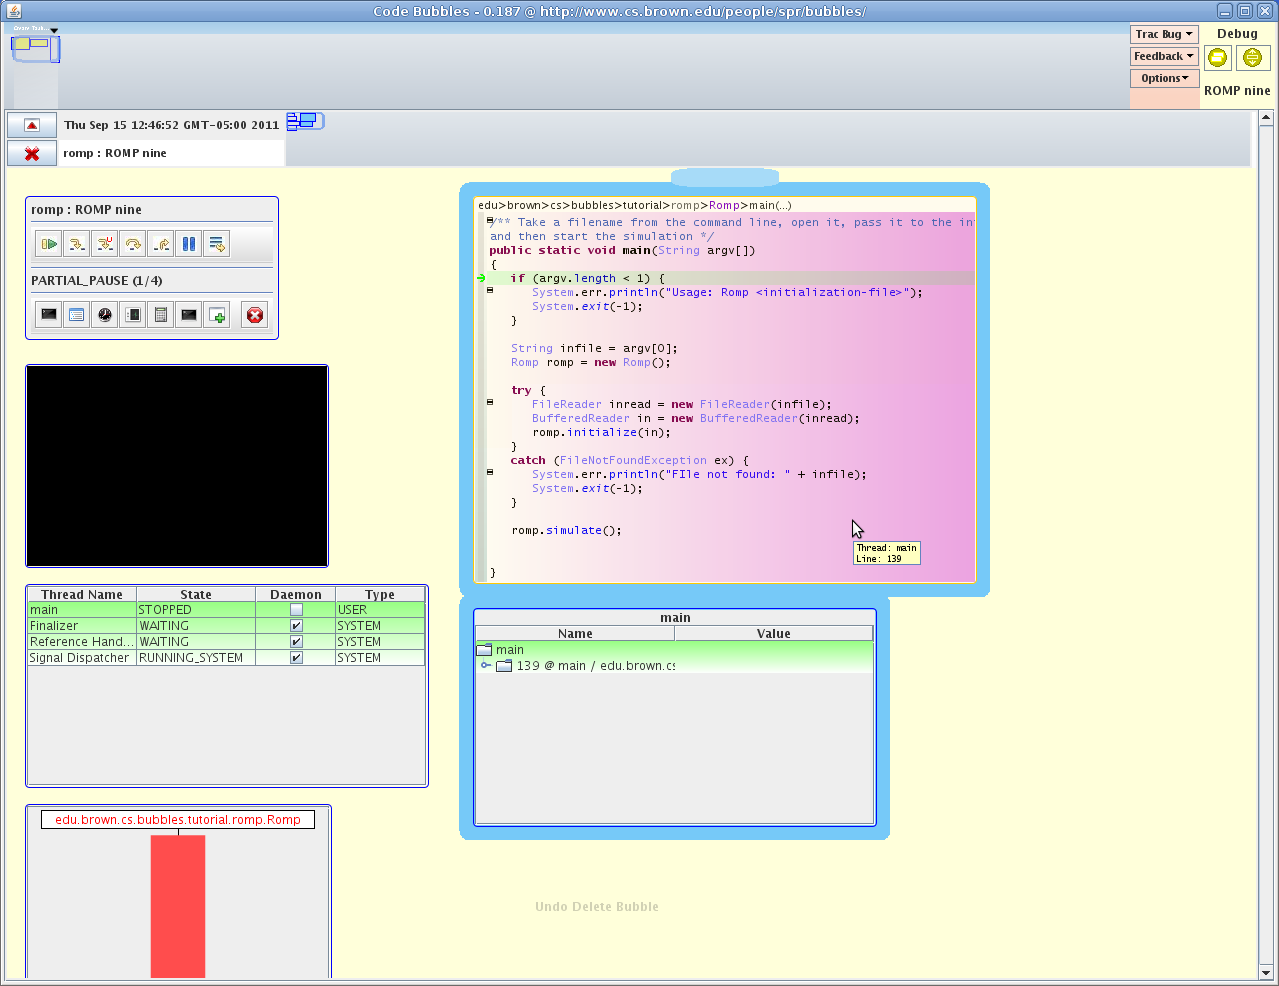
Because the configuration is set to stop in main, the program stops at the initial breakpoint. Here the system has automatically displayed two additional bubbles. The first is the source code with the current line hightlighted. The second is the stack display for the stopped thread. The source bubble is a fully functional editor just like the bubbles we worked with in the base display. Code bubbles supports multiple bubbles for the same piece of code, with automatic updating, so it would be perfectly acceptable to have this bubble also appear in the main area (or even twice in the debug area).
The stack bubble is a normal tree-table type view of the stack. It does support some additional features. For example, you can double click (or click and drag) any subset of this display into its own bubble. Thus you can have bubbles for a particular variable or stack frame. Second, by right clicking you have the option vieing the source or of "freezing" this bubble. Freezing will ensure that the system records the values displayed to some depth, and will prevent these values from being automatically updated as the program continues execution (which is the normal mode of operation). This gives you the opportunity to compare old and new values or just to record the values at some point in the program for later reference or comparison in another run. You might also note that if you display a single variable, the printable form of that variable is displayed at the bottom ala Eclipse.
The thread bubble provides a view of the current threads. The threads state is displayed in some detail, including whether the thread is currently doing I/O, running inside library code (vs. user code), or is deadlocked. You can also double click or click and drag from this bubble to get a stack display for any stopped thread.
The history bubble shows the history of the debugging session with time on the vertical dimension and the different objects/methods where the program was stopped in the horizontal. Different threads are shown in different colors. You can right click on any prior point in the history to show either the source or the values at that point in the session. Hence your debugging history is never really lost.
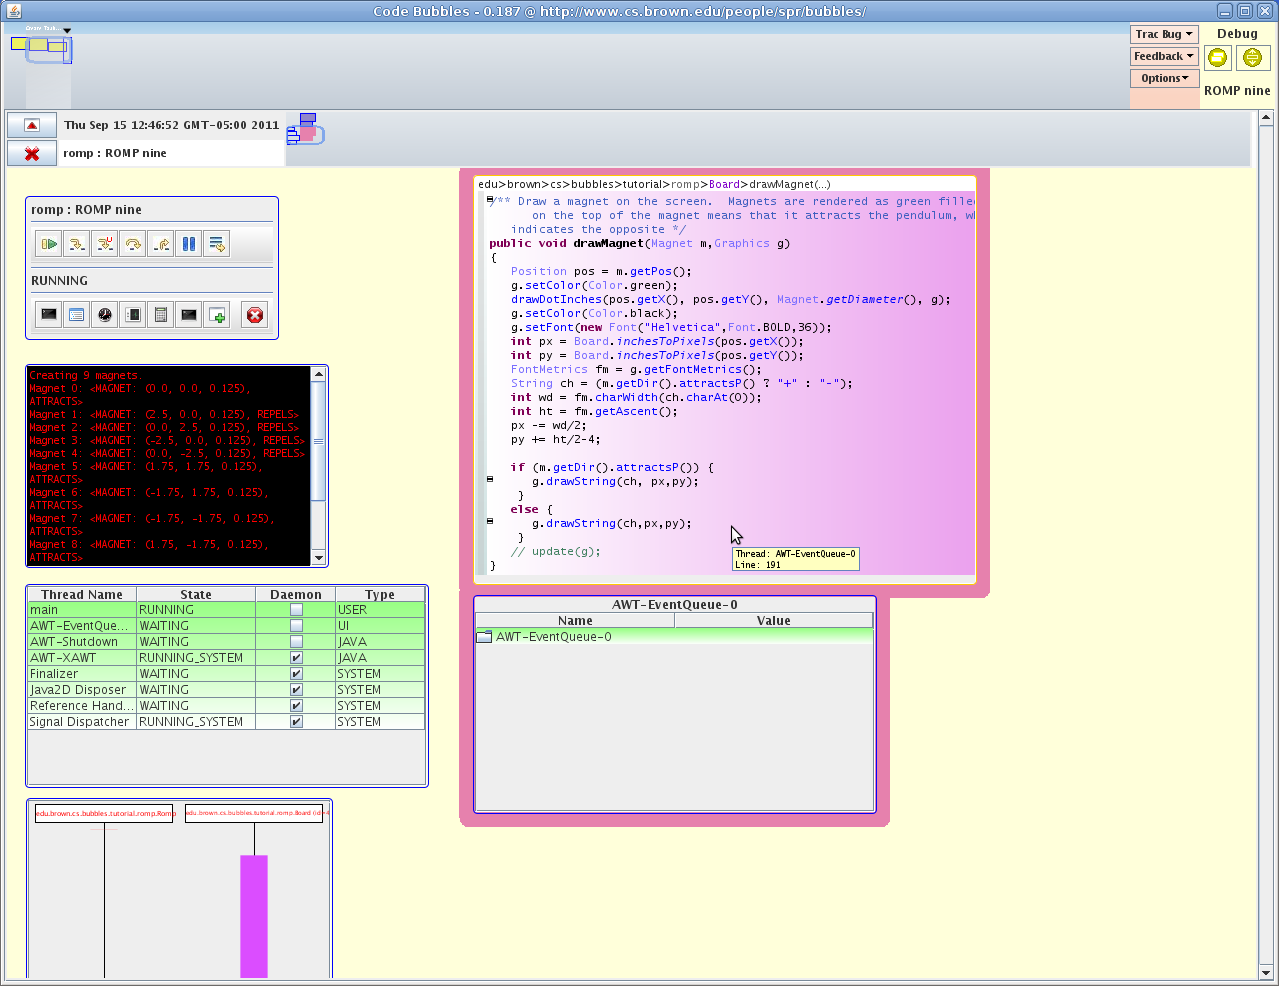
If we now hit the continue button (code bubbles uses the same play button for start and continue), the program will run and we see:
and note that our change worked. At this point we are done with the initial change and ready to do the more complex fix of changing the location of the + and - characters on the magnets. To get ready for this, first stop the program by clicking on the terminate button in the launch controller, and then go back to the main bubble area by either clicking on the left hand button in the debug area at the upper right or by clicking anywhere in the top overview bar. Note that the latter will move the current view to where you clicked, so you might need to move the view back to where your prior bubbles were.
Now that we are done with changing the pendulum color we are done with the drawPendulum bubble. There are several things we could do at this point. One, we could move to clear portion of the bubble area and start over with the new task, either starting again with the paint routine or starting directly with the routine we found before for magnets, drawMagnet. We could do this while leaving prior bubbles up on the screen or by first removing those bubbles using the menu we get by right clicking on the top bar. Starting again in a clear area would cause the system to assume we were starting a new task for the programmer's log and would prompt us to identify the task or to start a new one.
In this case, however, we want to start with the display we had. Since there is only one bubble that we don't need, lets just get rid of the bubble. That can be done by clicking on it with the middle mouse button. For those without a middle mouse button, you can hit escape (or control-W (command-W on the Mac)). The bubble disappears and is replaced by a shadow "Undo Delete Bubble". You can click on this to bring the bubble back. The delete button for a bubble will fade away over a period of a minute or two so as not to get in your way but while offering you enough time to undo the delete. Note that you can delete (and undelete) a whole group of bubbles by double clicking with the middle button on the colored group border.
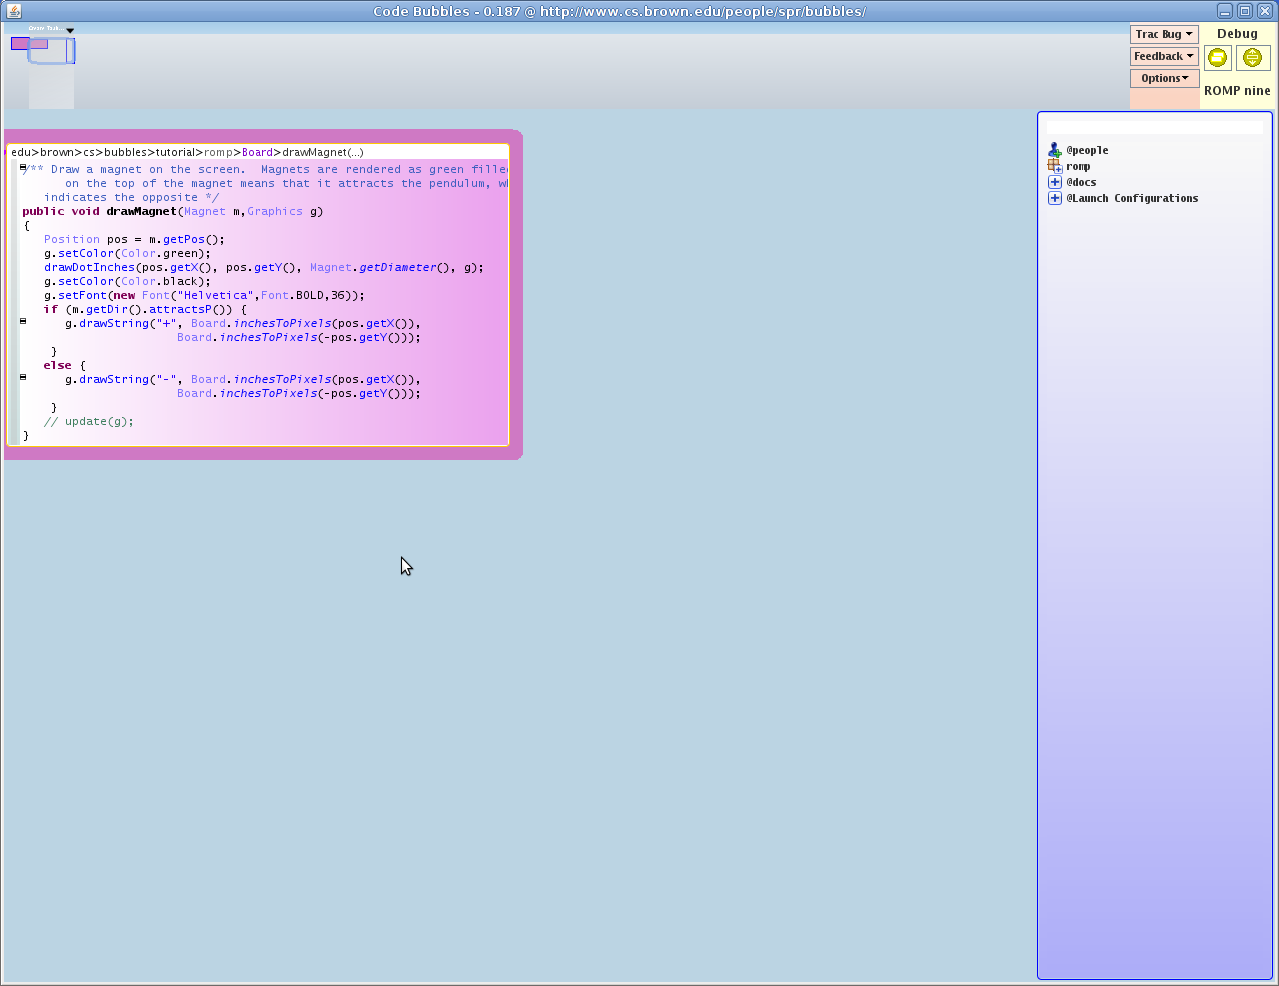
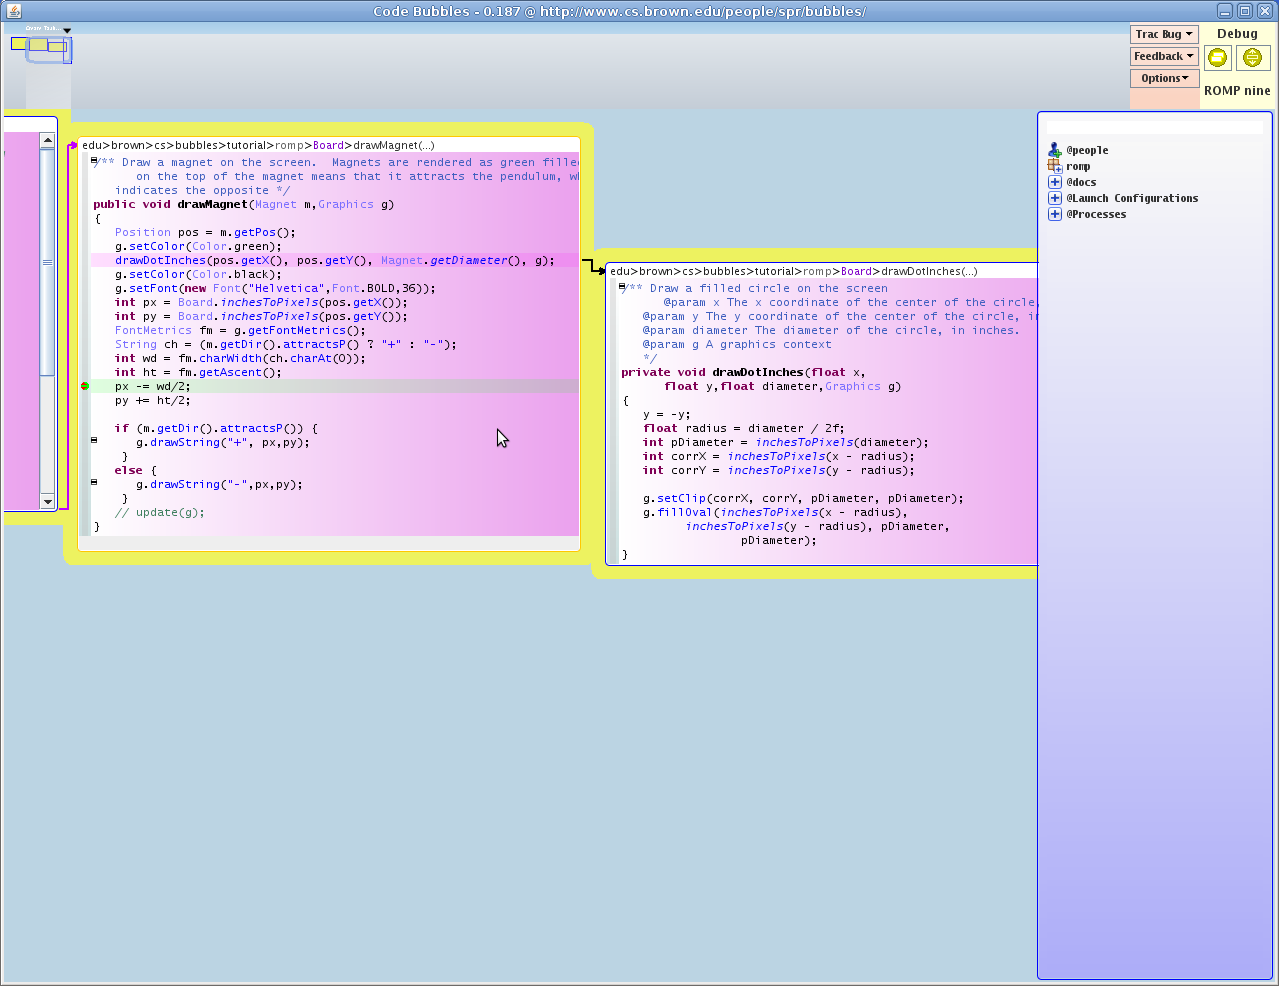
Now click on drawMagnet in the paint bubble and use F3 to bring up the corresponding method bubble. Reposition the display area so that this bubble is in the upper right (to give you more space to work). This can be done either in the overview area or by click-dragging with the right mouse button on the bubble area background (for up/down movement, the scroll wheel would work as well). You should get a display somewhat like:
In order to center the characters we want to display, we will have to know the size of those character using the current font. My knowledge of swing is pretty good, but not that good. I think there is a call based on the incoming Graphics object that might help and want to find out what it is. To do this I need to look at the appropriate JavaDoc.
Changing the position of the characters is going to have to be done by changing the coordinates of the two calls to drawString at the end of the method. To simplify our work, we first define two variables, px and py, to get the initial values (the values used in the calls as they are written) and then replace those values in the two calls. Do this as you would normally do while editing in Eclipse (or whatever your favorite code editor is).
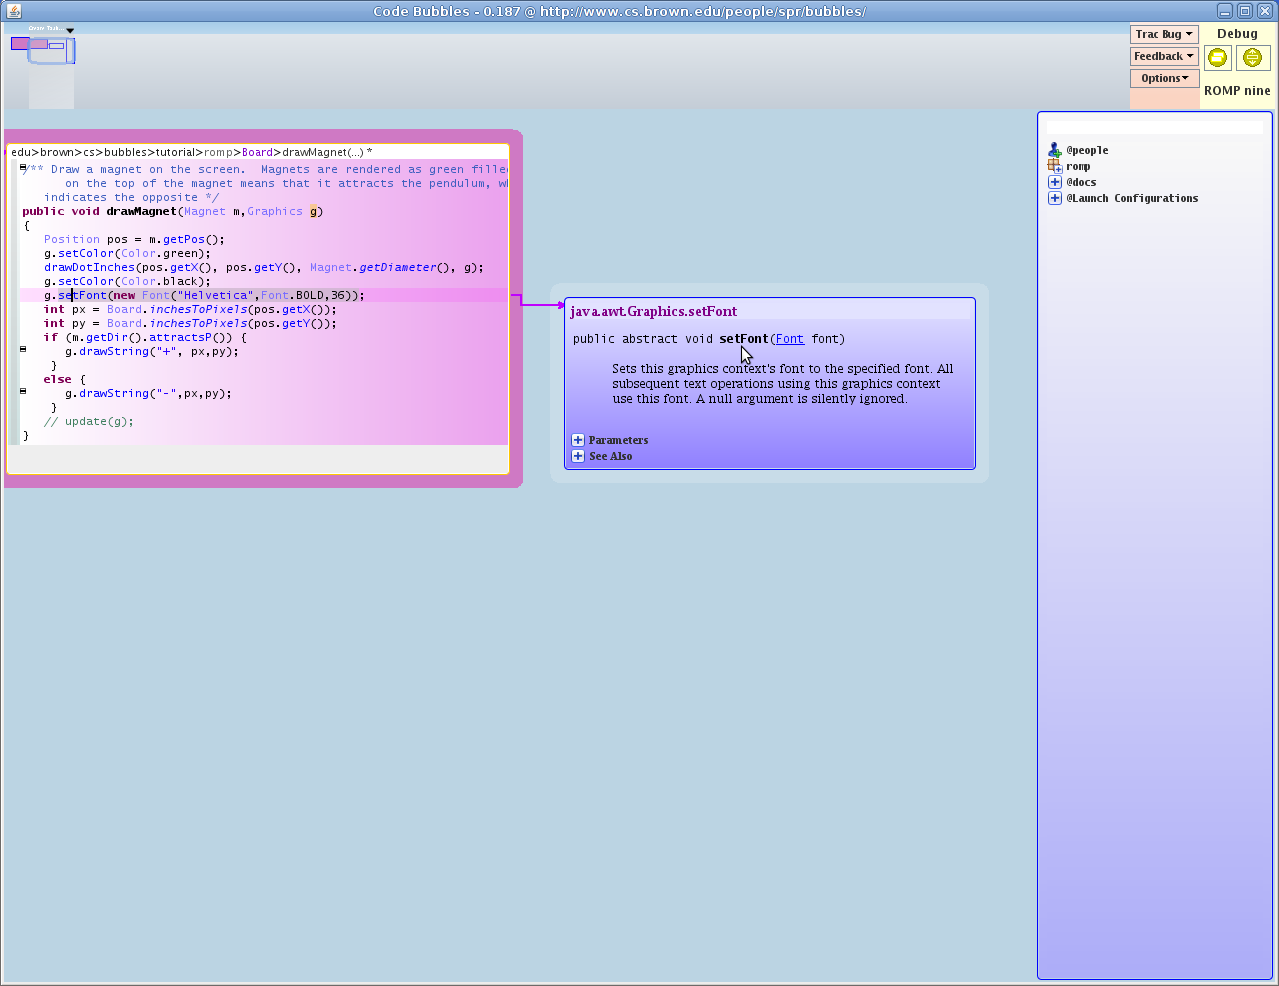
This could be done by looking up Graphic in the package explorer (or a documentation search window using conrol-right click). However, we want to take a different approach. Select a call based on Graphic, say the call to setFont in the middle of the method. Then use F3 to do a Goto Implementation.
Code bubbles determines that this method is not in your code but rather is a library routine. As such it will bring up the corresponding documentation window. (There is a command to do goto Documentation immediately as well, but this is easier.) Rather than bringing up all the JavaDoc for Graphics (as you normally might do), this only brings up the documentation for the particular routine:
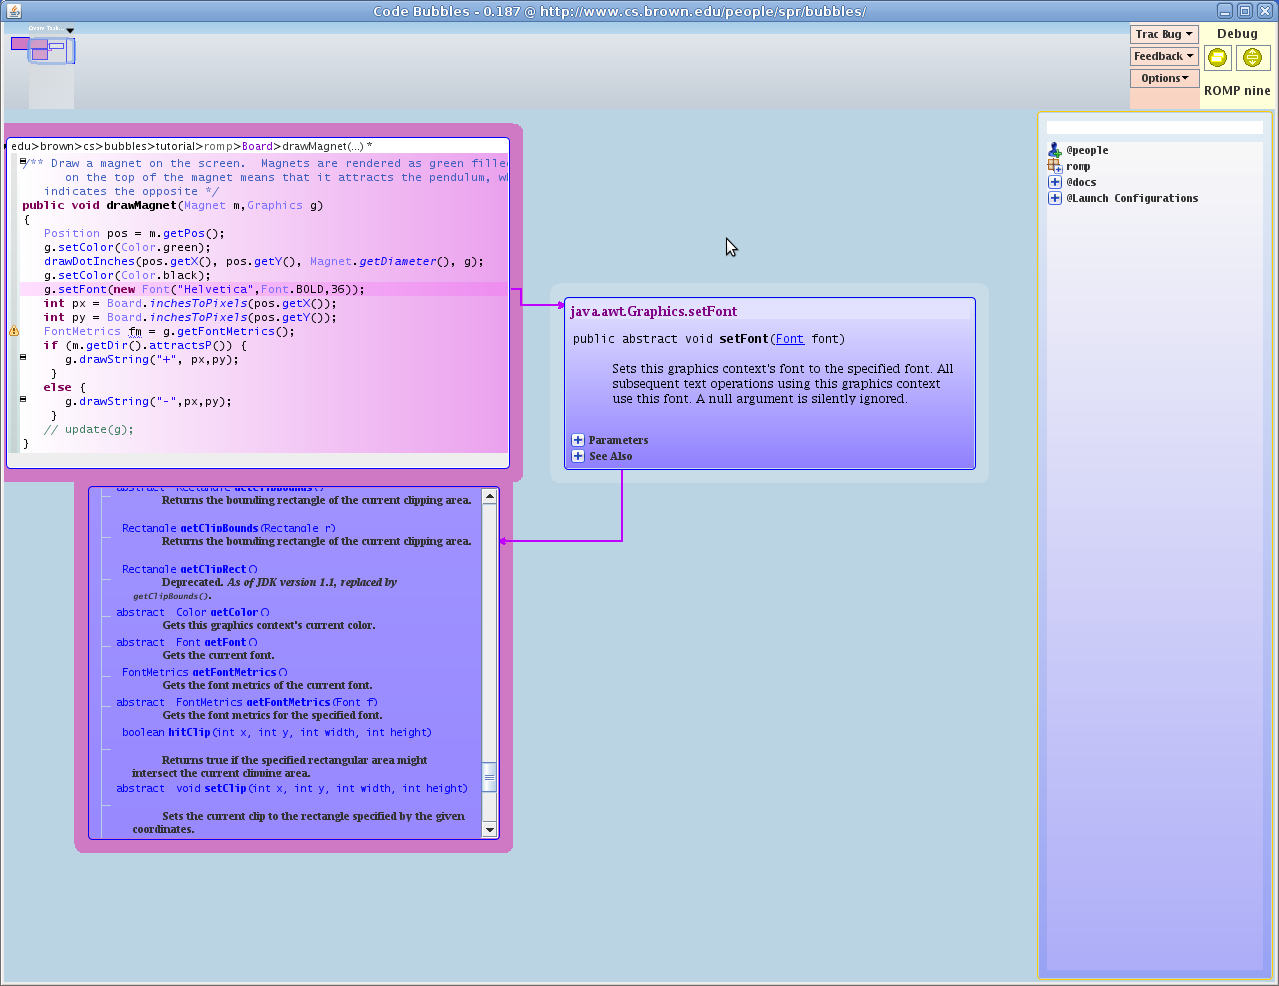
Then to see the JavaDoc for all of java.awt.Graphics, just click on the title line in the documentation window. In the resultant panel, you can select methods and then scroll down until you find a likely candidate: getFontMetrics.
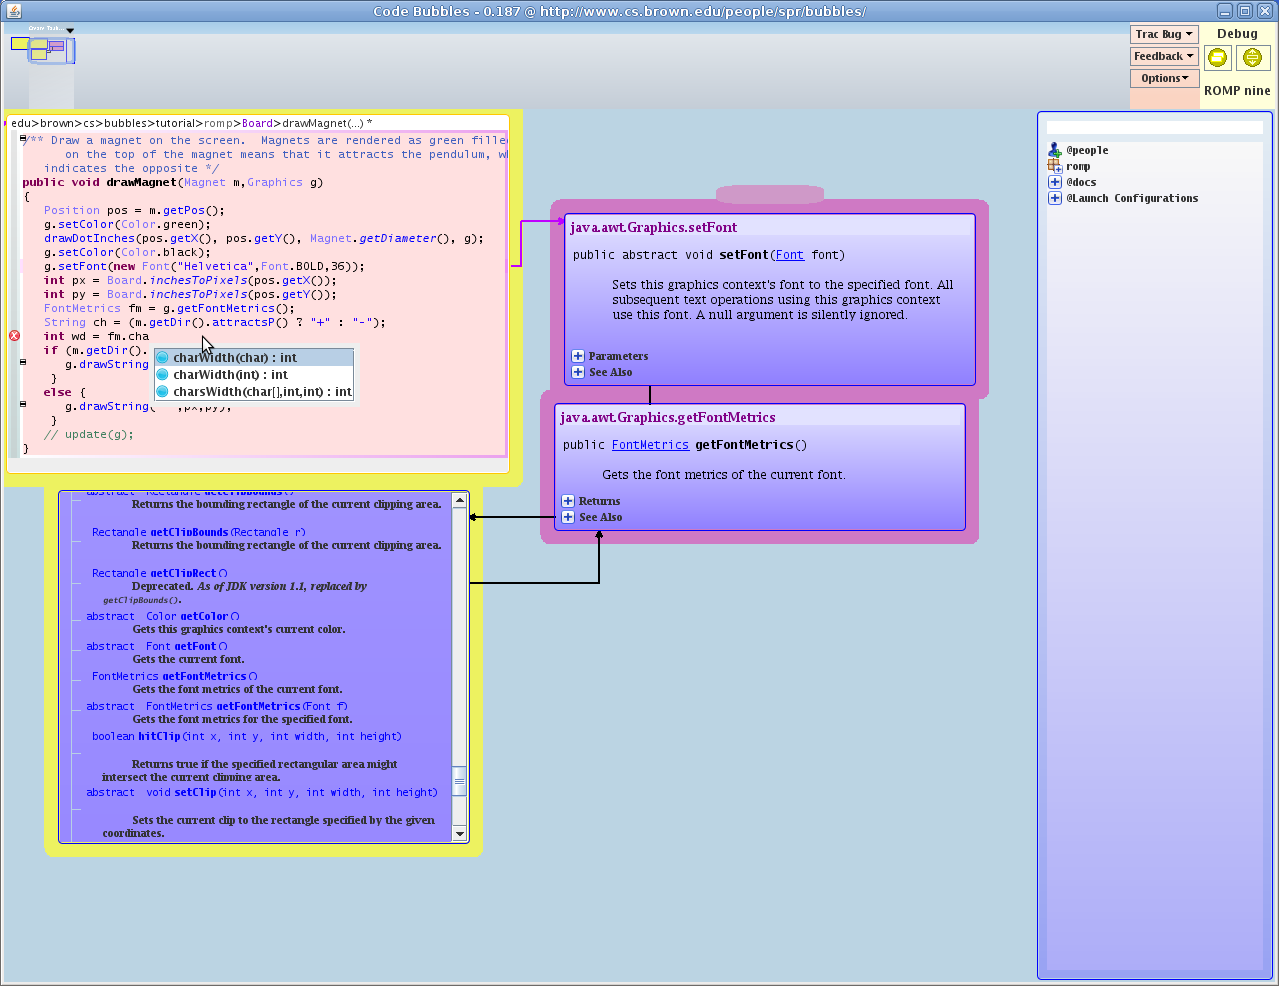
Now you can click on that method in the documentation bubble to get the documentation for the getFontMetrics. Next we want to add the appropriate call in the code. After the two lines defining px and py, lets enter a line that gets the FontMetrics object. Here you might notice that the code bubbles editor provides tooltips just like Eclipse does:
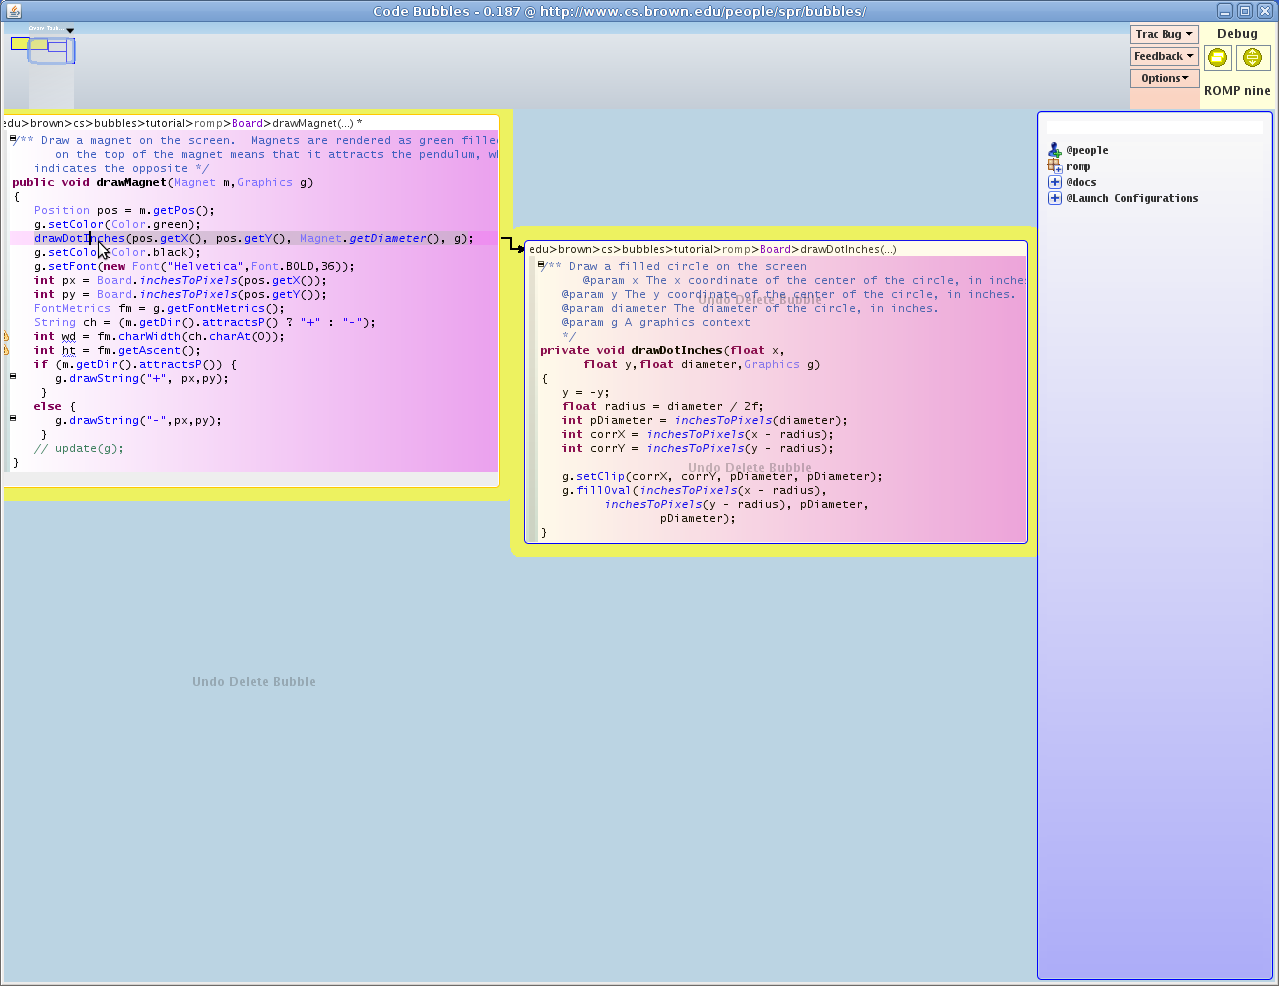
Now to determine the proper coordinates to pass to draw string, we need to know how the circle representing the magnet is drawn. The circle seems to be drawn by the routine drawDotInches, so we click on that and use F3 to bring up the corresponding method bubble. From this we note that the passed in coordinates denote the center of the circle, not the upper left corner as is used in Swing.
Given this, we next add the code to compute the proper offset for the coordinates given the width and height of the character to be drawn:

Next we try running the program again and see how things worked. We do this by clicking on the left hand button in the yellow debug menu at the top of the screen, and then clicking on run. Once we do this and we wait appropriately for the program to compile and start, we again get the main routine. Clicking continue after the initial breakpoint, we see that the characters are close to where we want them, but not exactly there. Our height computation is off a bit:
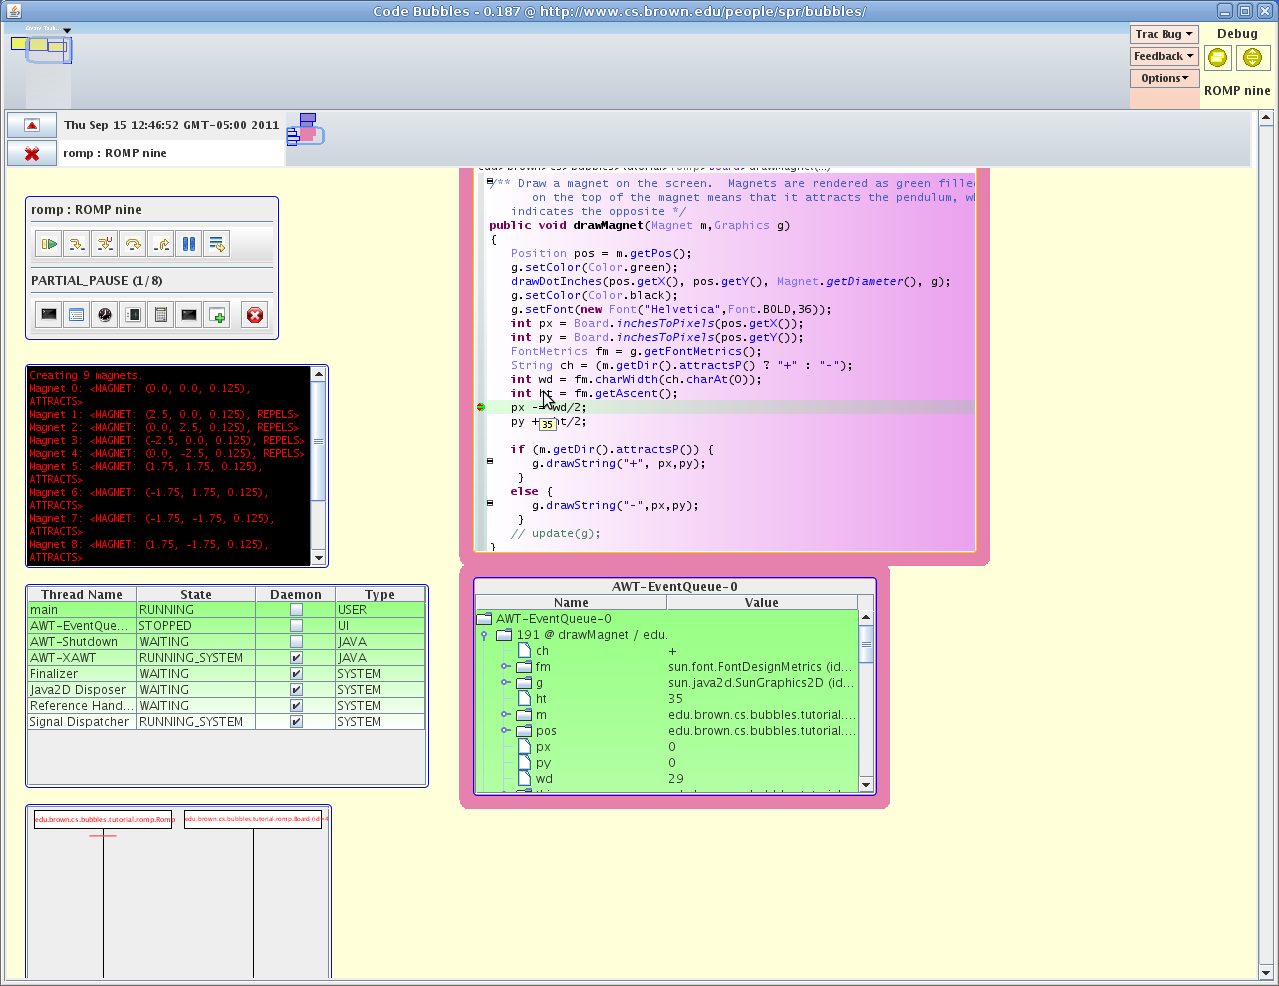
To fix this we need to understand what is going on. We go back to the main display by again clicking on the left debugger button, and then click in the gray area in the left of the editor on the line where we change px to its corrected value. Clicking here sets a breakpoint. Note you could also right click in this area and choose set breakpoint (as in Eclipse), but simply clicking is easier. The breakpoint shows up as a red dot. However, since we left the program running, the breakpoint is quickly reached, and the current line is highlighted:
At this point we want to go back to the debugger view in order to examine variables, etc. We again click on the left-hand debug button to swap views. We note that the drawMagnet method is shown here as well along with the stack view for the stopped thread. We can click on the top frame in the stack view to see the values of variables in this frame:
There are a variety of ways of examining the values of variables at run time. The stack viewer above is one. In addition, one can double click on any line in this viewer and get a new viewer of that particular variable. Alternatively, one can hover the mouse over the variable of interest and the value will be displayed as a tool tip. Finally, one can right click on the variable of interest in the editor and select the show value option.
In any case, we change the height by subtracting 3 (there must be a better way, but this seems to work), removing the breakpoint (just clicking on the gray area where the breakpoint is accomplishes this), saving (Control or Command S) and then continuing execution. This is close, but still sees off, so we change the 3 to a 4, save again and all seems okay. We have successfully fixed the program.
Next we want to clean up the code a bit, in particular we want to remove any compiler warnings. Here we just go to a black space in the work space by clicking in the overview area:

Code bubbles provides a bubble to display errors and warnings (and a separate bubble to display to-do items if desired). This bubble can be viewed by right clicking in the work space to bring up a search menu and then moving the mouse into the menu area above (or below depending on where you clicked) the search box. Click on the Errors/Warnings button:
To get a bubble that lists all the current errors and warnings. The bubble comes up a bit large (it assumes you have a lot of problems in the code), but you should know by now how to change its size appropriately if desired. If you want to always have the errors available, you can right click on this window to make it a fixed window and then position it as appropriate on the display.
In this case, there is only one warning that we need to fix. We double click on it to bring up the corresponding code bubble. Now because we are in a new area of the workspace, the system assumes we might be working on a new task and brings up a new log book dialog where we can either indicate which prior task we are working on or start a new task:
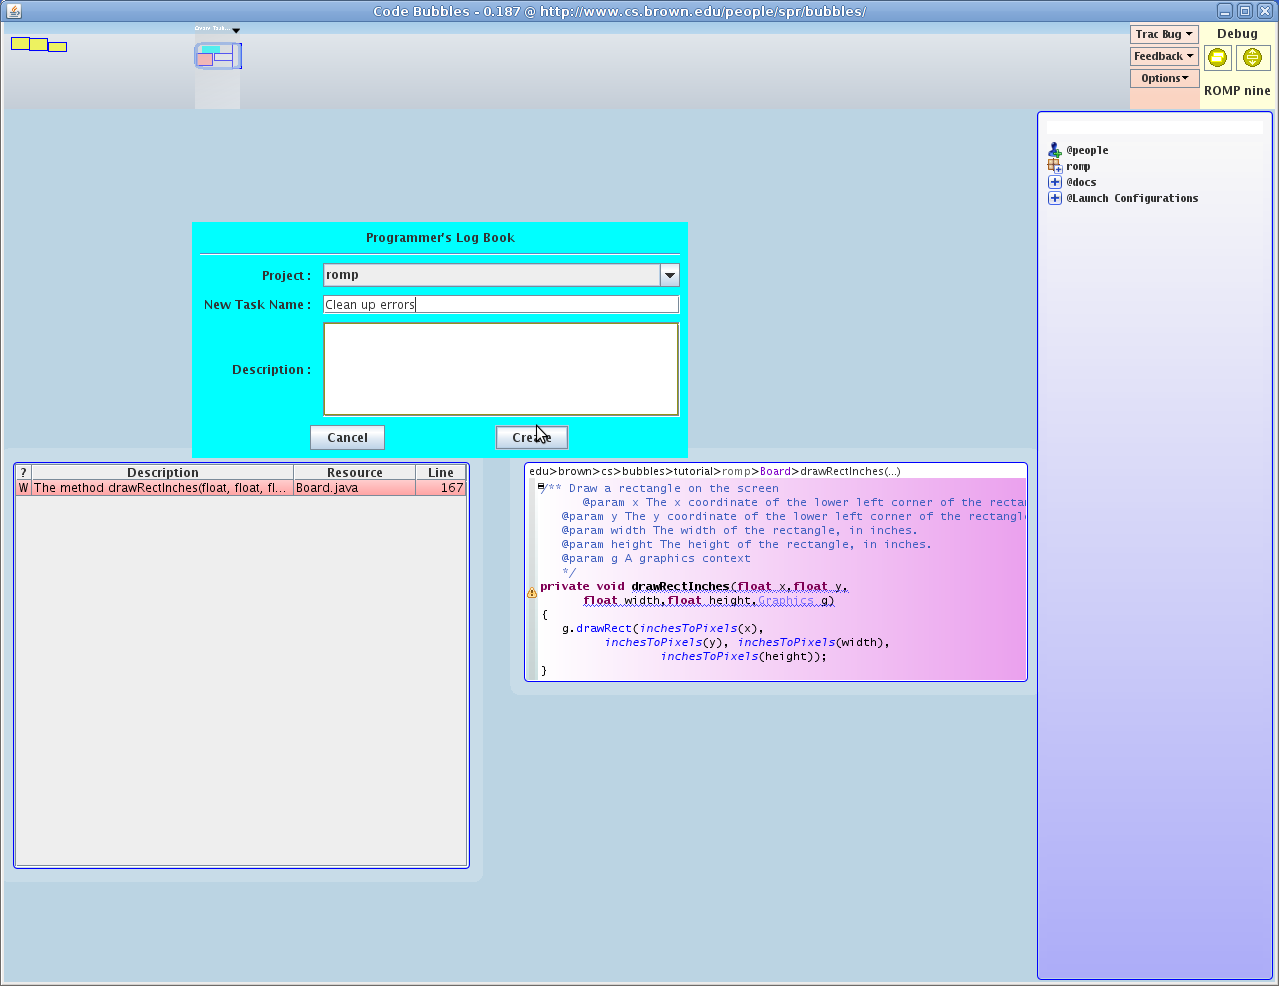
The method drawRectInches is never used. To delete it we need to select the method and remove it. Note that if we start by clicking on the little box to the left of the initial comment, the comment gets elided:
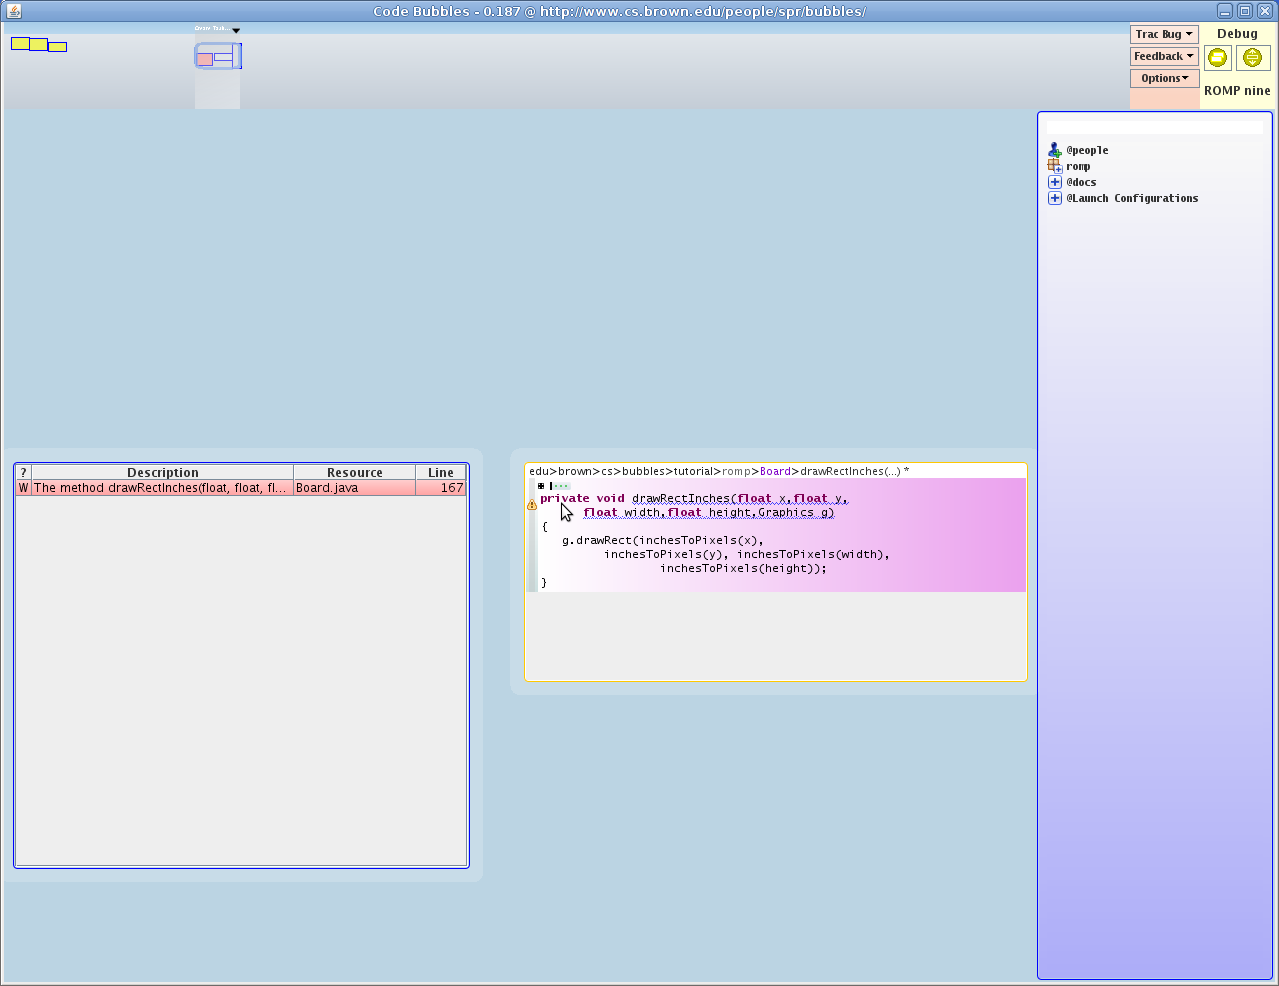
The easiest way to actually select all the code in the method is to start and the end and select backwards. Note that you can select over elided items:
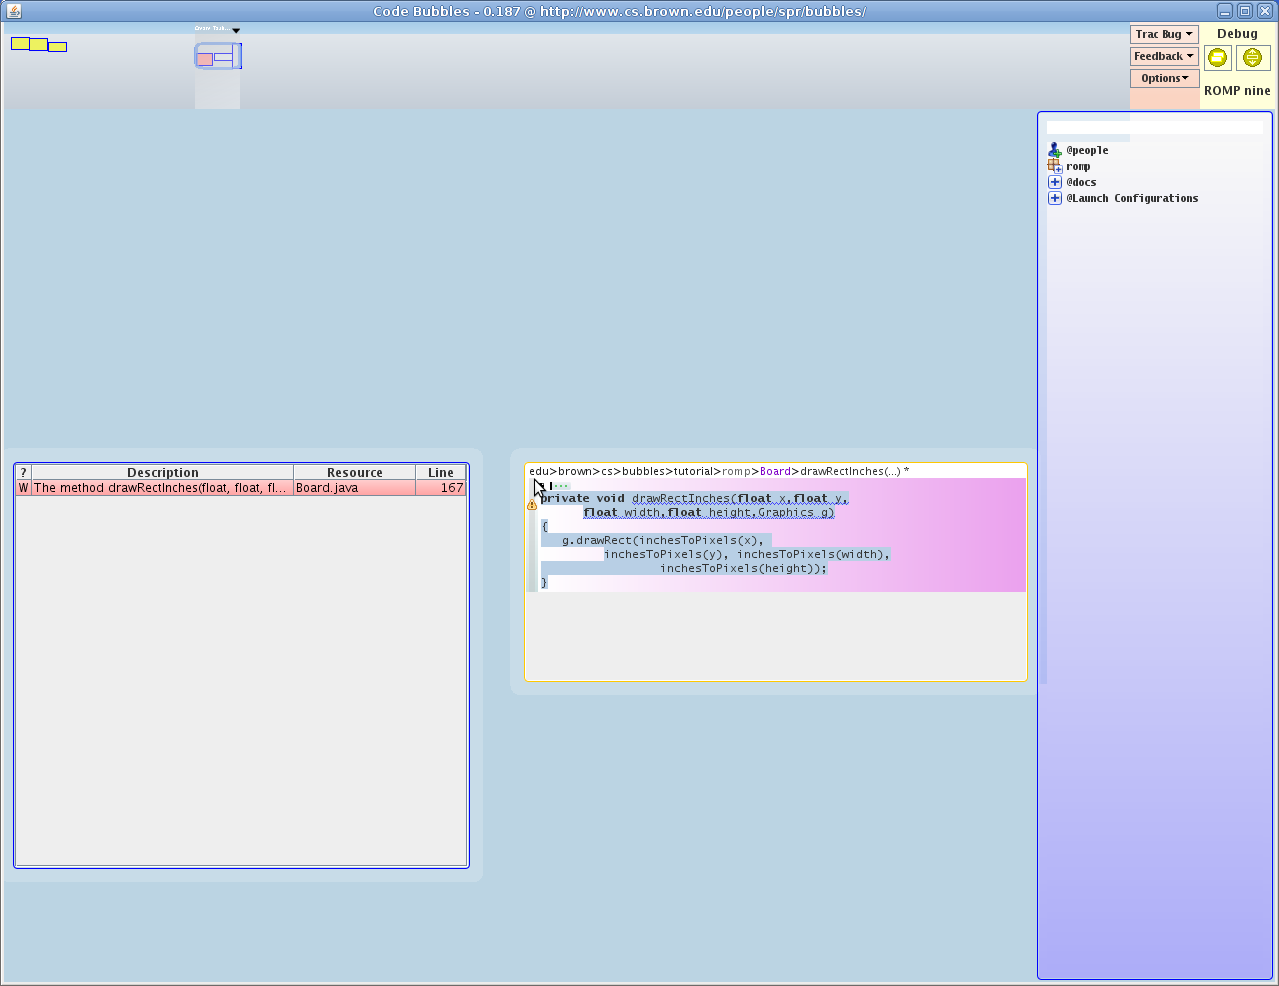
Hitting backspace (or control/command X for delete) should then delete the code, remove the error and leave us with a clean program. Hit save again, and we are done.
This tutorial only scratches the surface of how to use code bubbles and what can be done with the full environment. To get a better sense, you should try to use it and see what happens. We have tried to make most of what you want to do fairly intuitive, but I'm sure we haven't completely succeeded.
Some of the things you can try include: