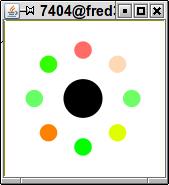
 The initial DYPER Panel. Each dot represents a performance agent.
DYPER is a performance analysis framework designed to work on production systems. The user can dynamically specify the allowed overhead that the performance monitoring process can use. Different proflets (agents) are used to obtain a variety of performance information including CPU activity, IO, sockets, phase analysis, heap utilization, memory allocation, and event handling.
This work was followed up by research on automatically constructing detailed performance models of complex Java systems in order to predict their performance under various conditions.
Controlled Dynamic Performance Analysis, WOSP '08 June 2008.
DYVISE: Performance Analysis of Production Systems: Research Demonstration, ICSE '09, May 2009.
Dynamic Detection of Event Handlers, WODA '08, July 2008.
Automated Analysis of Multithreded Programs for Performance Modeling by Alexander Tarvo and Steven P. Reiss, ASE 2014.
Automatic Performance Prediction of Multithreaded Programs: A Simulation Approach by Alexander Tarvo and Steven P. Reiss, Automated Software Engineering Journal, 2017.
DYMEM is an extension of DYPER that provides visualizations of object ownership in the heap. An object owns another object if the pointers to the other object are contained in the first object. DYMEM approximates object ownership by counting the number of references from an object of class A to an object of class B. Using this minimal information, it provides a display showing how memory is used in the application. The display updates dynamically as the program runs.
Visualizing the Java Heap to Detect Memory Problems. VISSOFT '09, September 2009.
Visualizing the Java Heap: Demonstration Proposal. ICSM '09, September 2009.
IBM PL/Day Poster. May 2009.
The initial DYPER Panel. Each dot represents a performance agent.
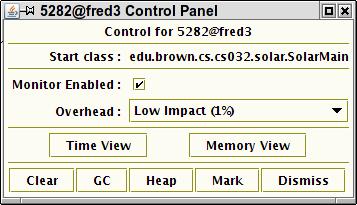 The process control panel
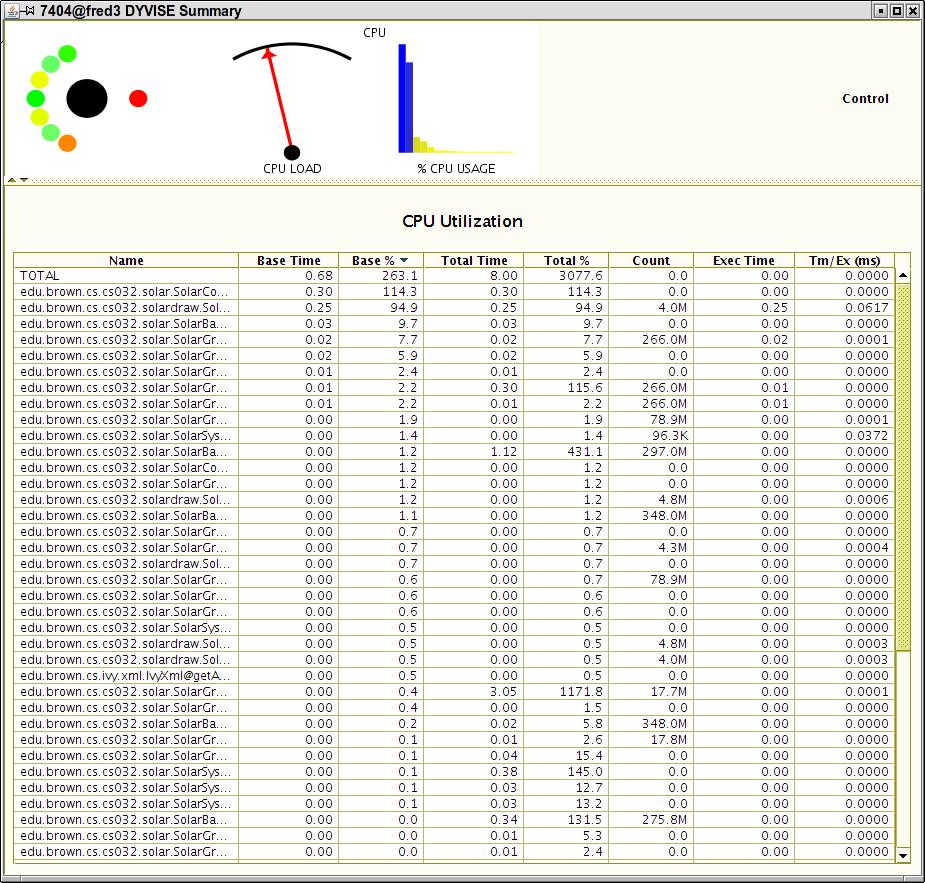
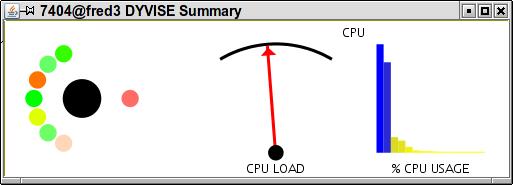 The panel expanded to show some detail for CPU utilization.
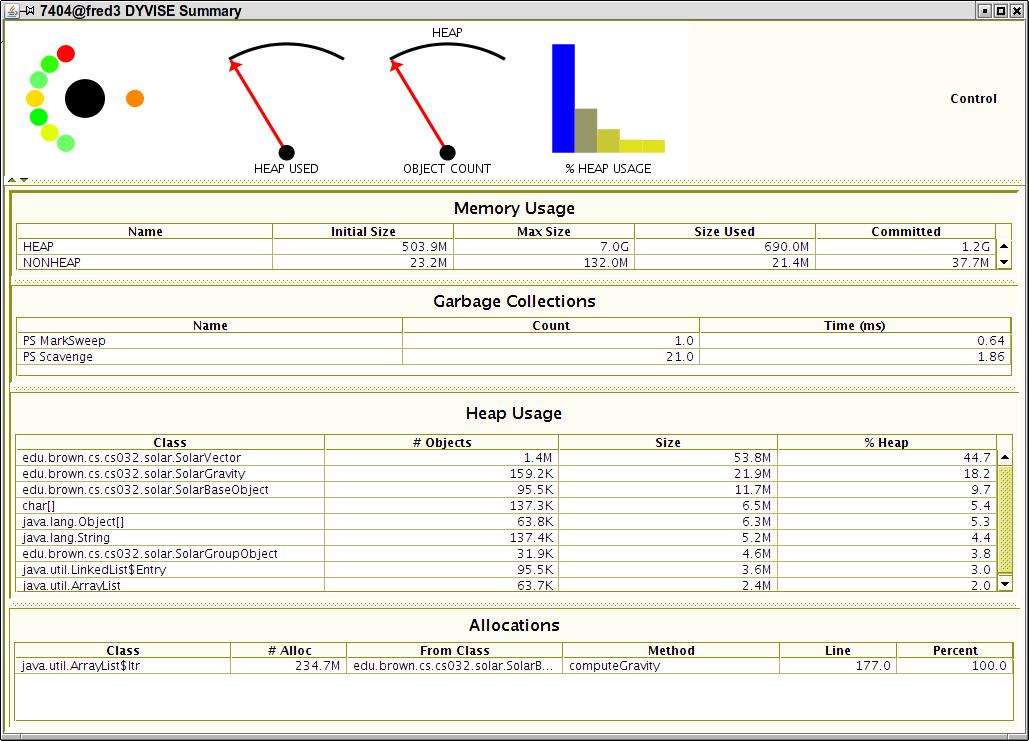
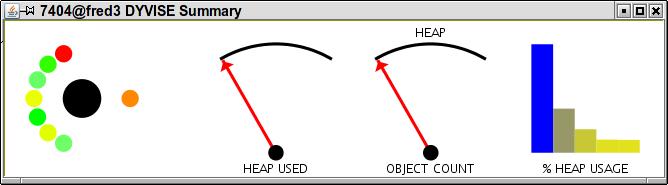 The panel show HEAP utilization
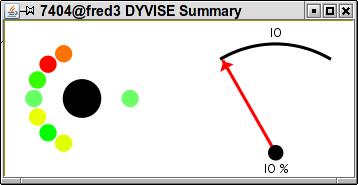 IO utilization
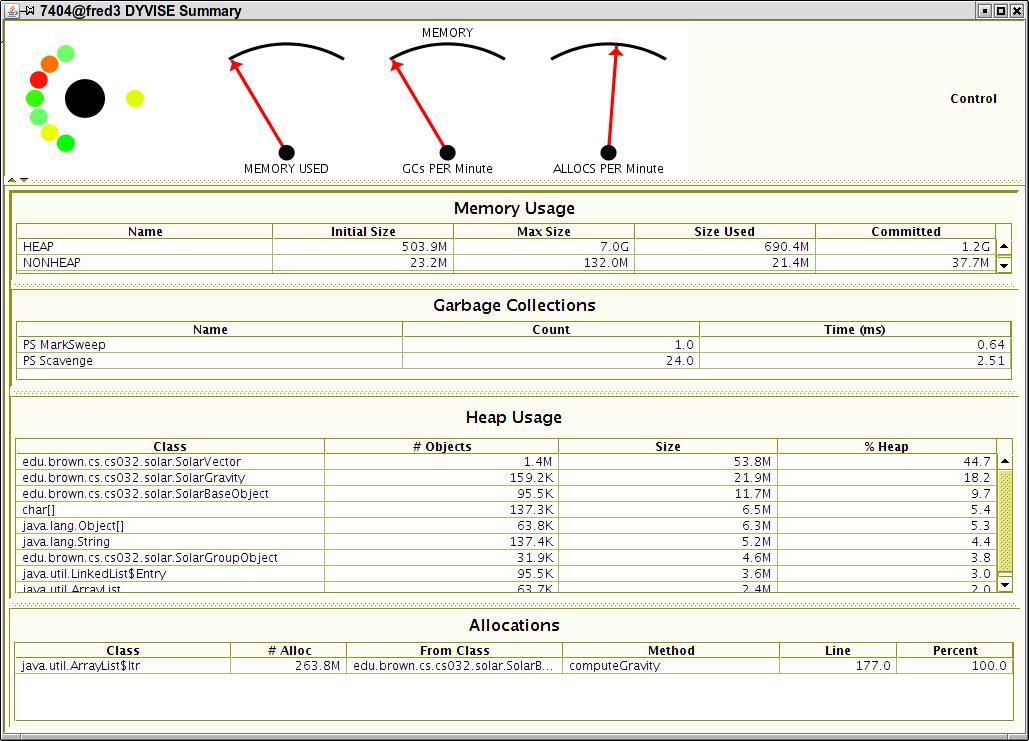
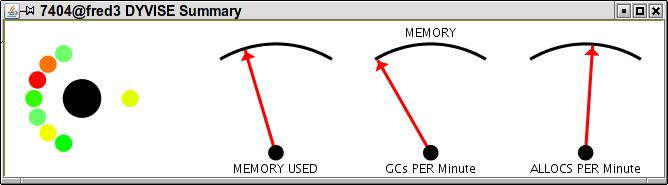 Memory allocation infomation
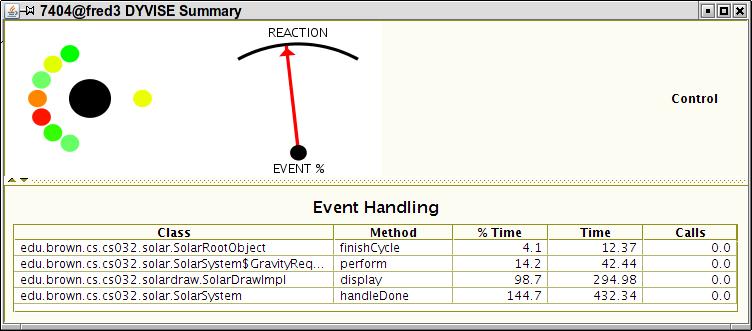
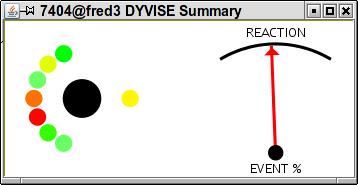 Event handling-based performance
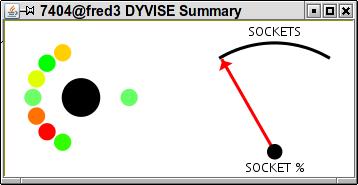 Socket utilization
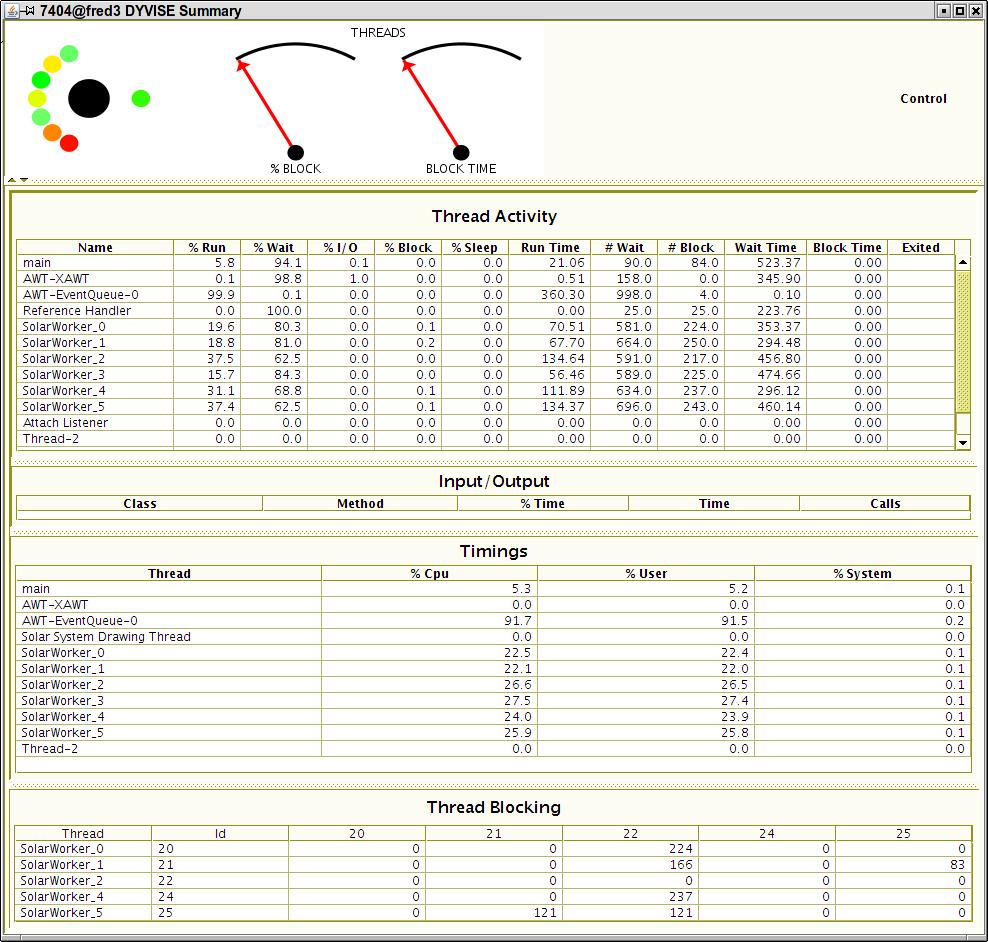
 Thread interaction information
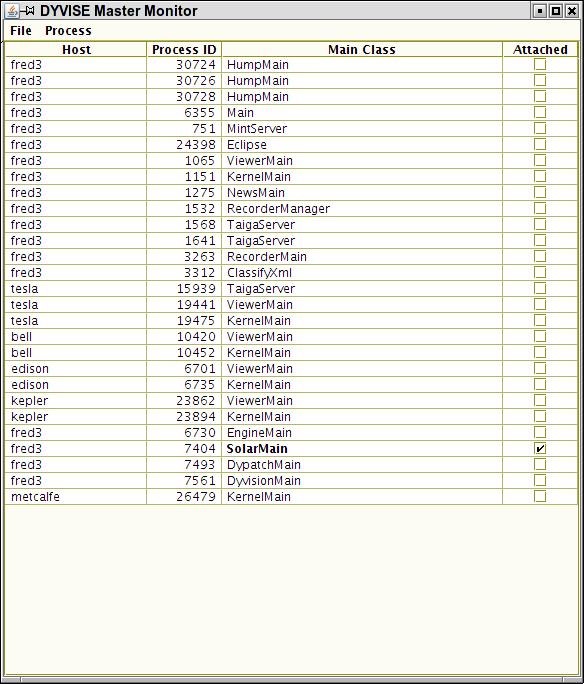 The process selection window
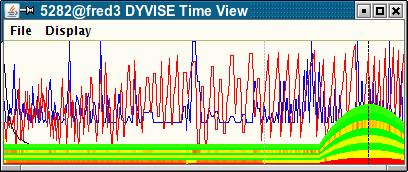
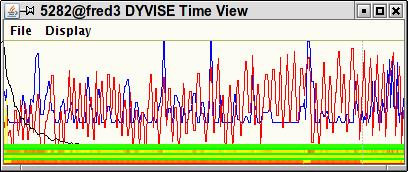 The time view showing the agent states and other statistics over time
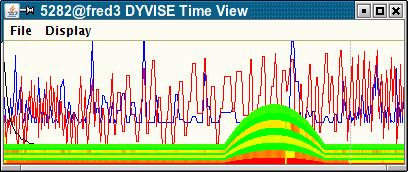 Selection in the time view
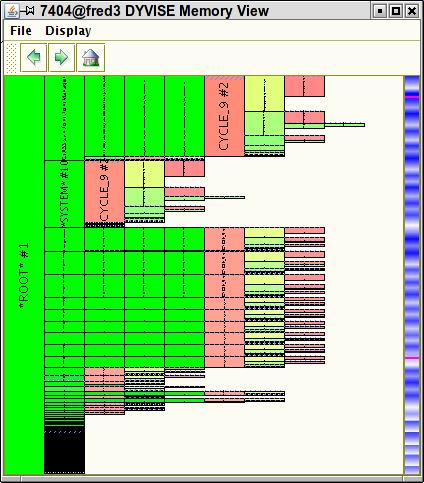 The memory viewer from DYMEM
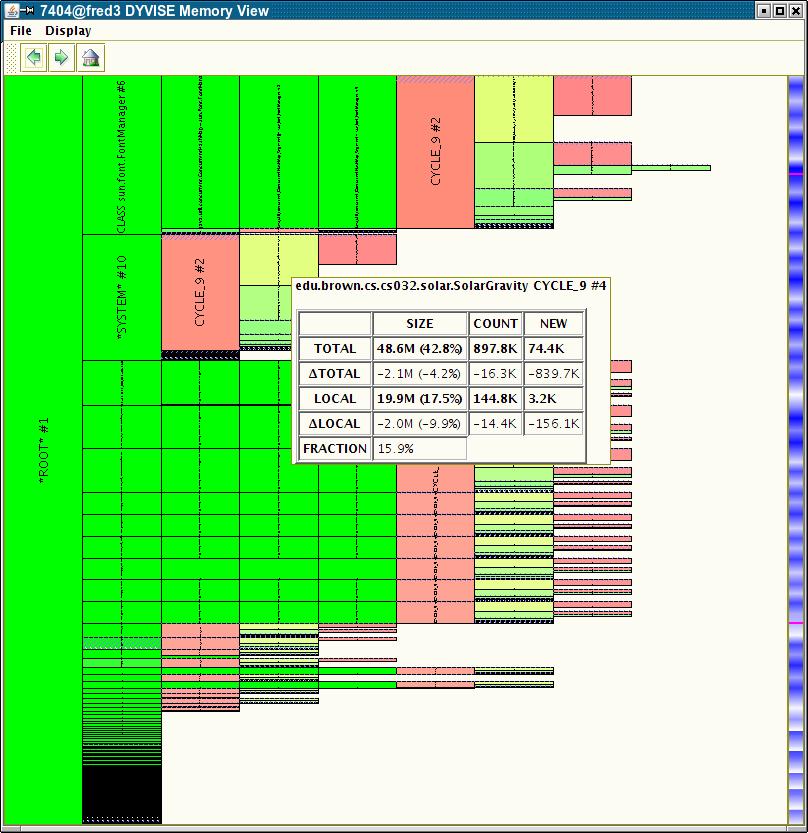
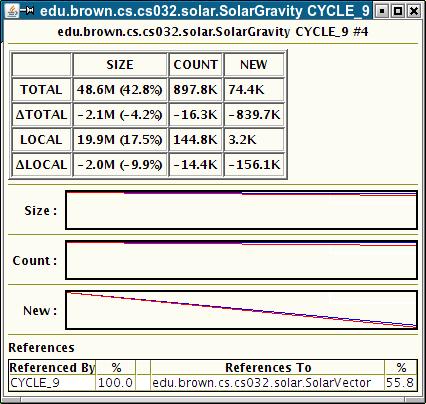 Details about a class from the DYMEM visualizer.