Steven P. Reiss
RESEARCH
Performance Analysis
1. FIELD
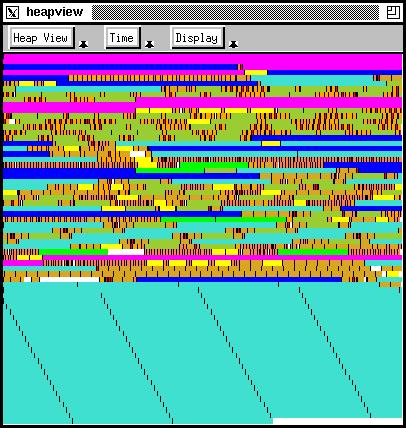
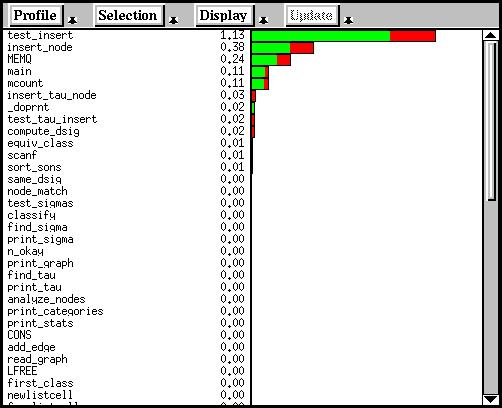
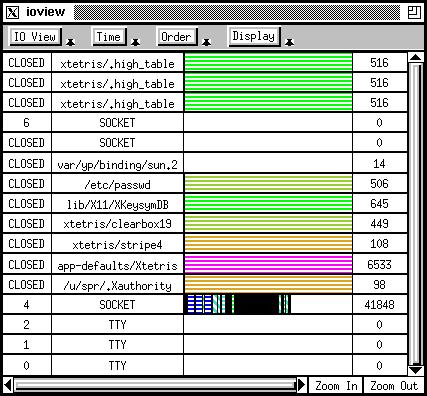
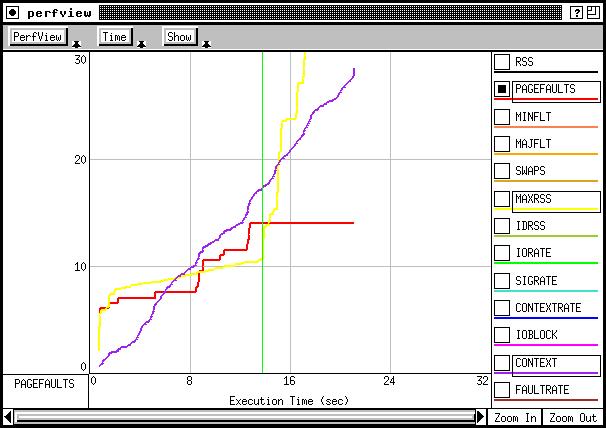
Our FIELD programming environment included a number of performance analysis tools, generally with visual interfaces. We modified UNIX gprof to provide dynamic results (rather than only at the end of the run) and results at the line level, and include a graph view of current behavior. Another view showed I/O activity by file or socket as it was happening. Another showed process activity. We also branched out into understanding memory behavior, providing a view showing a map of memory that updated as the program ran with relatively little overhead as seen above.
Resources
2. JIVE and JOVE
These systems, part of the BLOOM visualization system, were our first stand-alone attempt at low-overhead dynamic monitoring of Java programs as they executed. Using byte code patching (before Java made that easy), JIVE provided a view of what was currently executing down to the method level (grouped into classes and packages where appropriate) and thread states and interactions. JOVE provided execution information by thread at the line-level.
Resources
- Paper: Visualizing Java In Action
- Paper: JOVE: Java as it Happens
- Video: Video of Jive in action
- Video: Video of Jove in action
- Software: In bloom.tar.gz
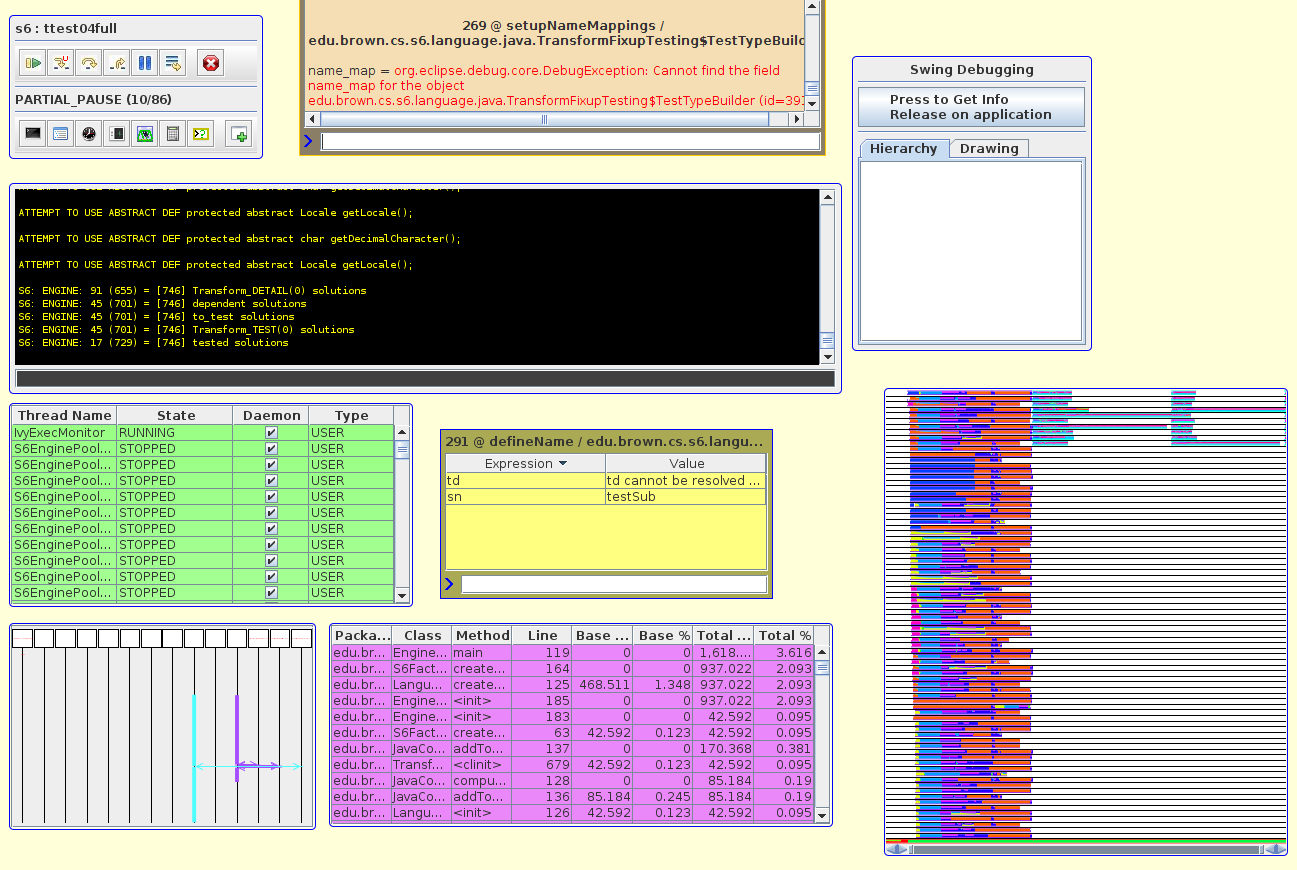
3. DYVISE
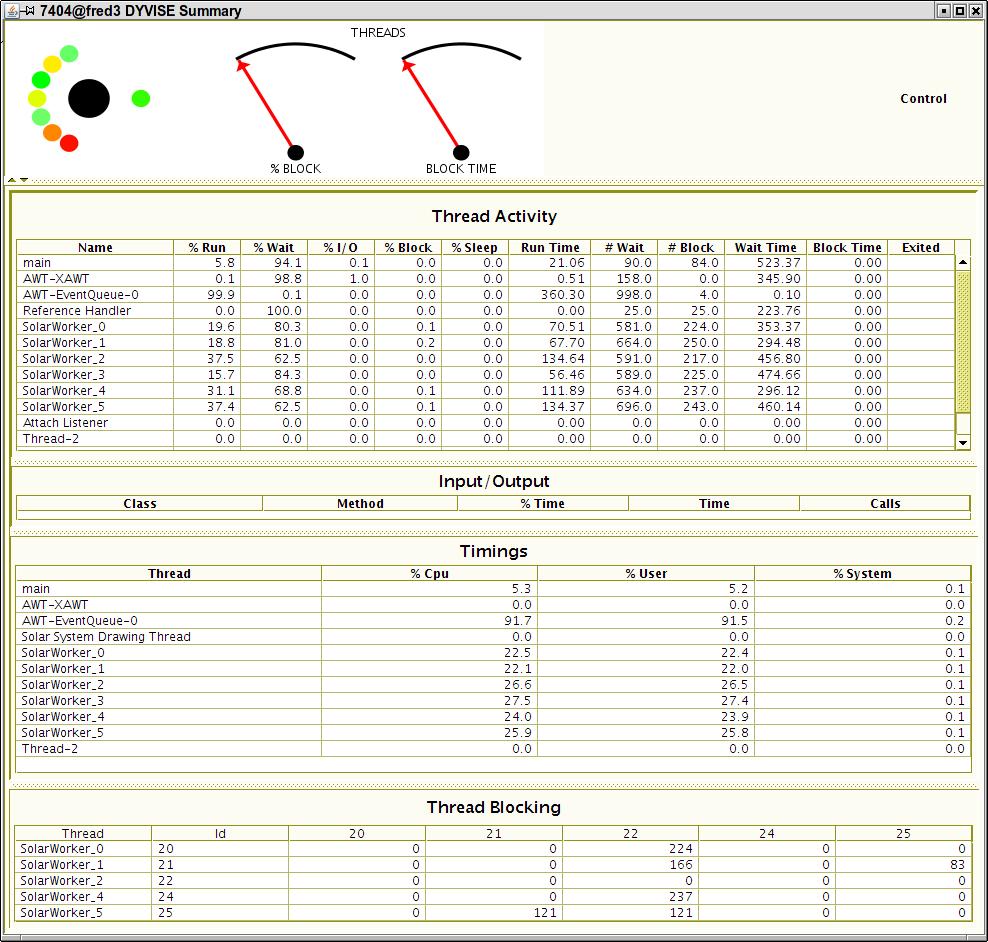
While JIVE and JOVE were fun, they didn't provide the detailed information necessary for performance analysis. DYVISE use more sophisticated byte-code instrumentation to provide detailed information about cpu, memory, threads, I/O, event, and phase behavior at whatever overhead the developer specified. Most information was displayed in a tabular form.
Resources
- Paper: Controlled Dynamic Performance Analysis
- Software: GitHub repository
4. DYMEM
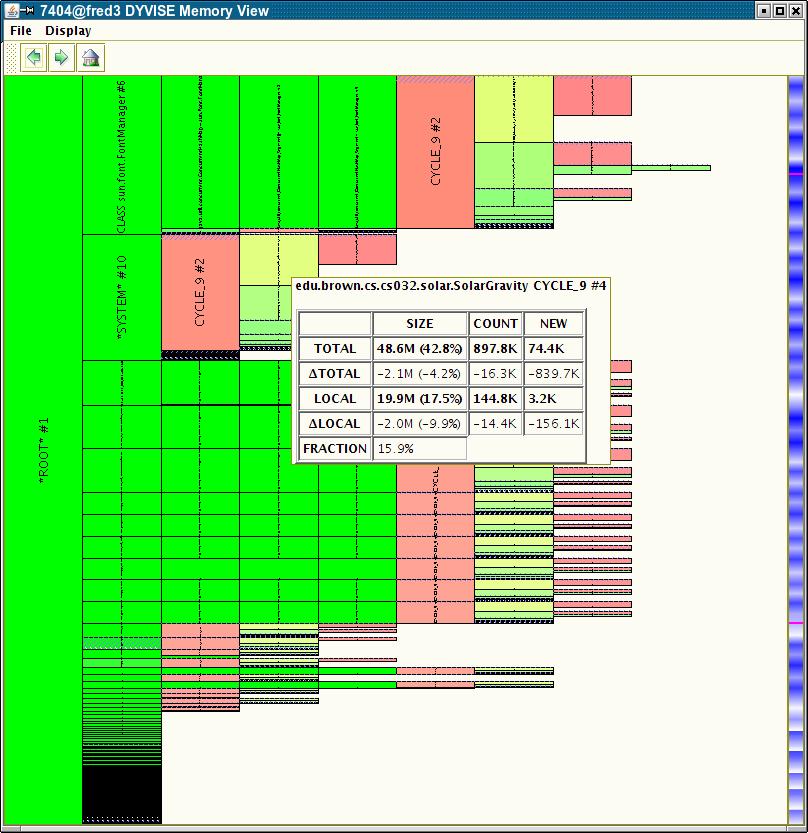
We next wanted to get a better understanding of memory behavior of Java programs, in particular, finding anomalies just as leaks. We created DYMEM which used dvmti to scan the heap periodically and then deduced memory ownership relations and displayed the result as a tree. DYMEM is included in DYVISE.
Resources
- Paper: Visualizing the Java Heap to Detect Memory Problems
- Software: GitHub repository (Part of DYVISE)
5. DYLOCK
We next concentrated on understanding locking behavior in Java programs. This tool collected information during a Java run using lightweight instrumentation. It analyzed locking behavior to characterize the types of locks and found their usage patterns. It could provide information either as the program was run or after the run. This was also part of DYVISE.
Resources
- Paper: Dynamic Analysis of Java Locks
- Software: GitHub repository (Part of DYVISE)
6. CODE BUBBLES
Just as FIELD provided a variety of performance tools, our current Code Bubbles environment includes several dynamic performance views. It provides a light-weight instrumentation package that is included in every debugging run. This is used to provide currnt infomration on thread state as well as CPU performance infomration that is updated continually during the run. Later tools provided a view of threads, tasks, and locking behavior that was specialized to the application and created automatically based on information from prior runs.
Resources
7. Automatic Performance Prediction
While the above efforts concentrate on understanding the performance of a system either as it is running or immediately after it has run, Alex Tarvo considered the problem of understanding the performance if the program were run under different circumstances. He did this by building a model of the system and then simulating that model under various assumptions. The model was built from data collected during a single run of the system. The model incorporated knowledge of disk and operating system behaviors. The resultant simulations were able to predict actual performance with about a 10% error, matching the state of the art.